
The 52-week high and low serves as an important indicator for many traders. First, it acts as a reference for establishing the relative current value of a stock. Second, traders can use these prices to determine if a breakout is about to take place. The 52-week high and low both provide plenty of useful information. We will discuss all of it in this article, so keep reading to learn more.
What are the 52-Week High and Low?
One can often interpret the 52-week high and low as the maximum and minimum price level that a particular stock reached this past year. However, this is not the case. We also need to consider the closing price to determine the 52-week high and low.
Let’s illustrate with an example. Suppose during a trading session, the price peaked at $100, but at the end of the day, it dropped to $98.5. To determine the high or low, one would only consider the closing price. In this case, the $100 peak price is irrelevant. To simplify, we can express the 52-week high and low mathematically with the following formula:
52-week high = maximum (P1, P2……………………Pn)
P represents the closing price of each trading session.
Likewise, the 52-week low = minimum (P1, P2……………………Pn)


The Importance of The 52-Week High and Low
The 52-week high and low can be useful for several trading strategies. For example, when the price manages to rise above the 52-week high, then it might signal a breakout, prompting the traders to buy. Similarly, if the price falls below the 52-week low, it could indicate an opportunity to sell.
For stocks with a history of low volatility, the 52-week high can act as a resistance level, and the 52-week low can be a support. Traders can use the 52-week range to predict the movement in price and act accordingly.
An Example
The chart below shows the 52-week price of Amazon shares. In the initial stage, there was an uptrend. However, since July, the price has been range-bound.
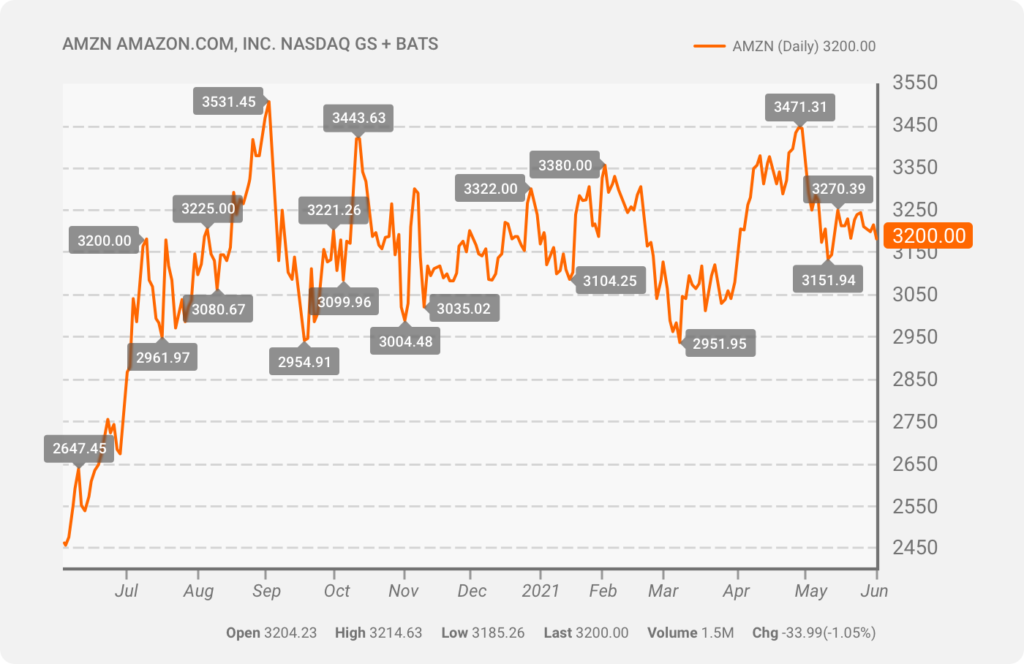
The arrow at the top represents the high, while the arrow at the bottom represents the low. Now we can see that there have been multiple instances when the price appears to exceed the high. However, afterward, this level acted as a resistance. We can see how there was a fall in price every time the line was tested.
Similarly, the price indicated by the lower arrow acted as a support, and this prevented the stock price from dipping further.
It may so happen that the stock price exceeds the one represented by the 52-week high in the future. This would give an indication to the traders that a breakout is possible.
How to Find the 52-Week Highs and Lows
The procedure to determine the high and low for a 52-week period is fairly straightforward. You can find out the following steps to determine what you want to know:
- Find the stock using the symbol or name.
- Look into the summary section for the 52-week high and low. In many cases, the 52-week range is provided in the summary section.
- If the range is not provided, ensure that the price chart shown is for a 52-week period. Hover the cursor on the topmost point of the chart. This should represent the 52-week high. Similarly, the lowest point would be the 52-week low.
The method provided in Step 3 can be less accurate if the actual peak is not discernible by looking at the chart. One can also download the closing price for the period and apply the mathematical equation discussed earlier.
Risks of Trading Based on The 52-Week High and Low
Like every technical indicator, the high and low level does not guarantee how the stock price would behave. We can point to two example cases when the movement is in contradiction to our expectations.
Case 1: An asset in a consolidation phase
When the price is trading in a range-bound manner, one would expect the 52-week high to be the resistance level and the low as the support. Suppose the price is trading very close to the low. In that case, we expect the price to increase, giving the trader a buy signal. If the trader executes a long position and the price drops further, they suffer a loss. Instead of trading range-bound, there could be a breakout, with the share price falling rapidly.
Case 2: An asset in a breakout phase
As mentioned earlier, if the price exceeds the 52-week high, it would indicate a breakout in the stock price. If a trader follows this cue, he is expected to buy when the price is over the 52-week high and sell when it is lower than the 52-week low. But, again, the trend may not necessarily continue the way we expect it to. You could see a reversal from the breakout. Traders generally wait for the price to move further away (higher from a 52-week high or lower from a 52-week low) before taking on a position. This ensures that the possibility of a breakout is higher.
In the two cases above, following patterns based on the range can lead to a loss for the trader. One way to minimize this loss is to maintain a stop-loss order.
52-Week High and Low Reversals
When the stock price trades close to its 52-week high, traders expect the price to trade lower in the future. As a result, many are willing to sacrifice the potential for future profit because they believe that the scope for appreciation in price is limited. This applies to a 52-week low, where traders expect this to be a support level and expect it to rise.
Reversals can be an effective intraday strategy. If the price manages to touch the high or low during the trading session, traders can reasonably expect the trend to reverse. Professional traders should leverage this information along with other technical indicators as well as trade volume metrics. We can use additional technical indicators to predict reversal patterns, including the descending wedge or the rounding bottom. When you see these patterns close to the maximum or minimum price over a 52-week period, traders should expect a reversal.
If the reversal does not occur, a stop-loss order should be put in place to minimize the loss. However, as stated earlier, many traders prefer to play the wait and watch and only enter once the reversal in trend becomes apparent.
Examples of a 52-Week High and Low
52-week high: This can act as a resistance level and a starting point for a breakout. Through the charts, it can be seen how both the scenarios can be witnessed.
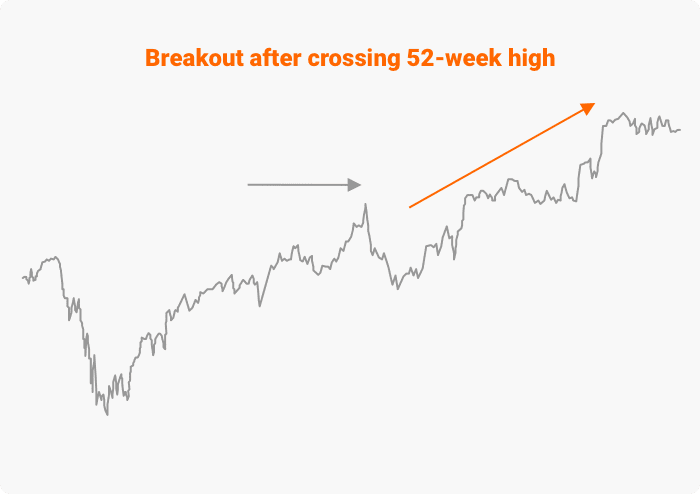
The chart above shows a strong uptrend as soon as the price crosses the maximum price. This is because the chart comprises closing prices over 18 months, and the breakout occurs when the price action manages to breach the resistance level.
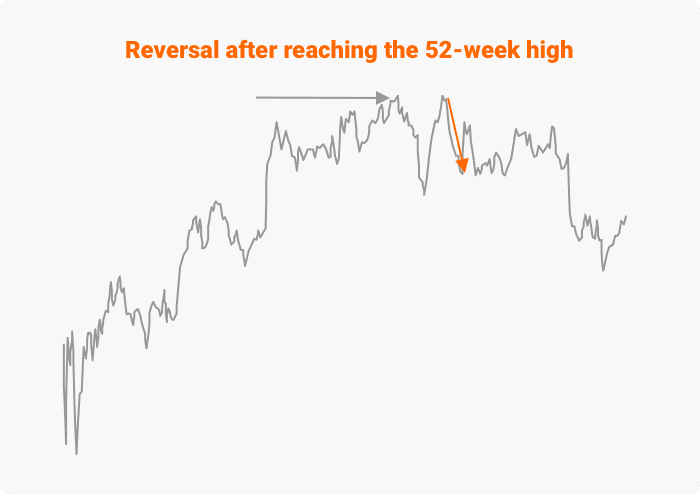
It can so happen that instead of continuing with the momentum, there is a reversal when the stock is trading close to its 52-week high. The same can be illustrated in the example below:
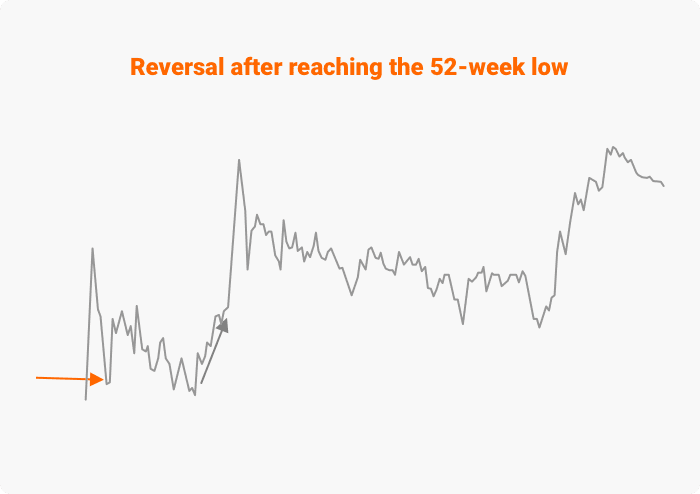
52-week low: Again, the same trends, i.e., breakout or reversal, can also be observed when the price is close to the 52-week low.
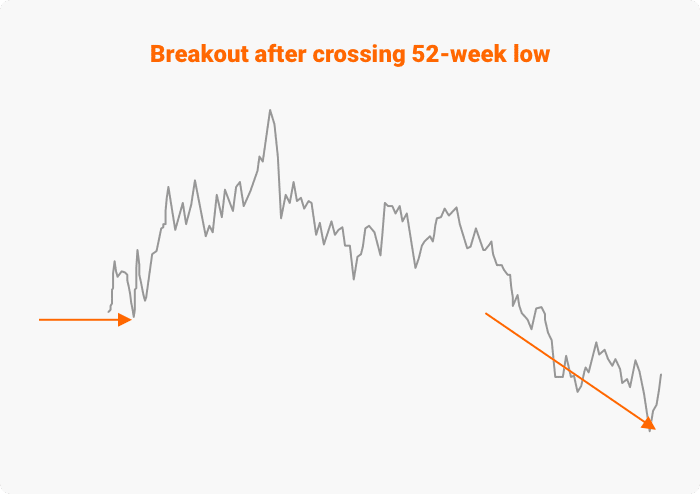
The figure above shows that the 52-week low can act as a support for some time. However, we saw a strong downtrend when the price crossed this level.
When the 52-week low acts as a support level, we can observe an upwards price reversal. In the previous example, we saw several such reversals before the price started dropping sharply. It is generally the case wherein the support level is tested multiple times before the downtrend develops. This can be considered in case of a resistance level too.
The patterns we observe around the 52-week range can be beneficial for day traders. Not only scalpers but also swing traders can generate profitable trades from these trends.
Conclusion
The 52-week range may be simple information, but many traders find it immensely helpful. It can be a useful tool, especially for someone new to trading and looking for a simple approach. Even expert traders often use it for their trading activities. It is also a measure of value that tells us how to place the stock compared to data sets within the year. Many analysts tend to base their predictions on how the price fares compared to the 52-week high or low. The range is also a good indicator of how volatile the stock is and whether it’s too risky to trade.