We are all aware that each asset class has its own specifications in terms of fundamentals, associated risks, and trading characteristics. However, did you know that there even are technical trading indicators with the explicit purpose of easing the trading of certain types of financial instruments? In this guide, we will dive into the Commodity Channel Index. Our goal is to find out how to interpret it and spot overbought and oversold signals and emerging trends. We will go through the best practices using the CCI indicator and reveal the best types of signals it can generate. Let’s get to work!
What is the Commodity Channel Index (CCI)?
The Commodity Channel Index is a momentum oscillator that helps determine when the traded asset reaches an overbought or oversold state. Traders also use it to better assess the direction and the strength of a trend and spot reversals and extremes.
The CCI indicator was developed by technical analyst and mathematician Donald Lambert. He introduced it in Commodities magazine in 1980.
As its name suggests, the indicator’s initial idea was to increase trading efficiency in the commodities market. It did that by mitigating timing challenges associated with entering cyclical and seasonal markets. At the time, this was a significant problem for technical traders. That’s because they were struggling to adequately forecast seasonal market changes and take into account cyclical events resulting in price fluctuations.
Thanks to its efficiency, the CCI indicator became a favorite tool also of equity and Forex traders over time. Most use the indicator to determine their entry and exit points, when to jump into a trade or when to avoid one, and whether they should add to an existing position, etc.
The CCI helps traders achieve that by comparing current price fluctuations in the traded instrument with historical ones.
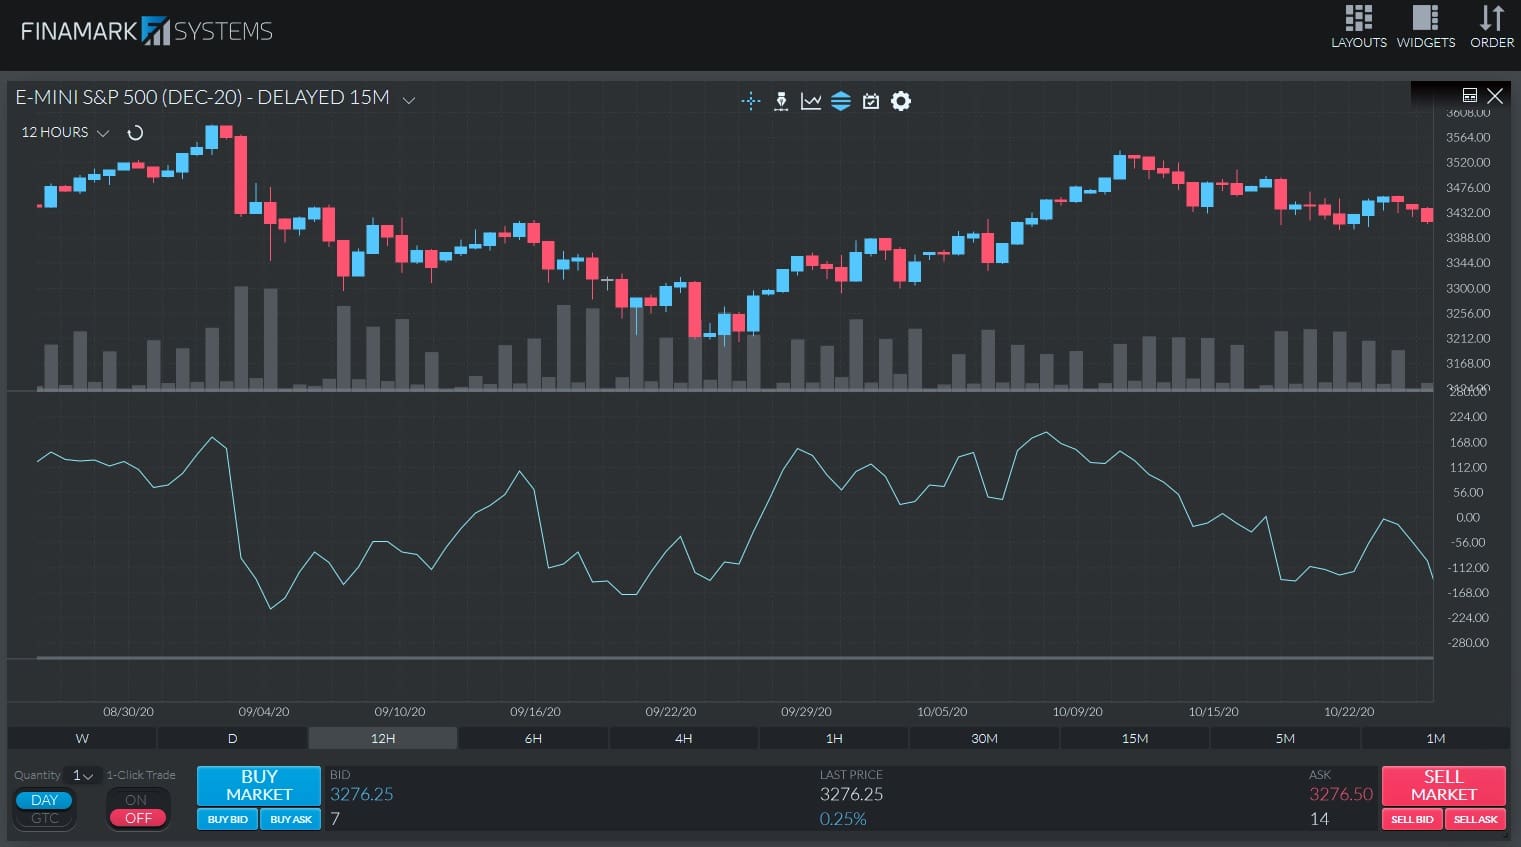
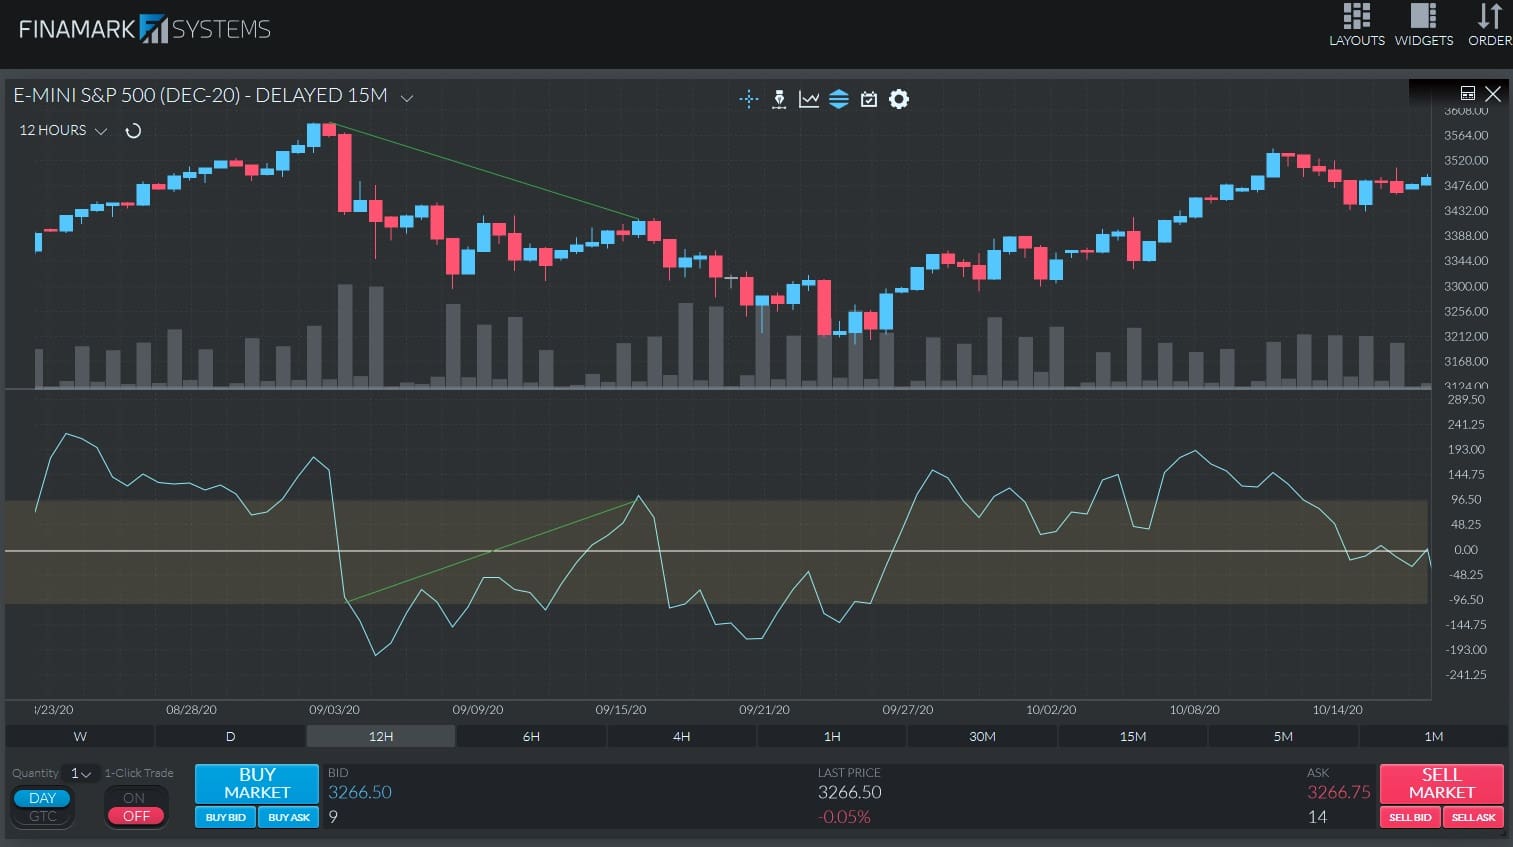
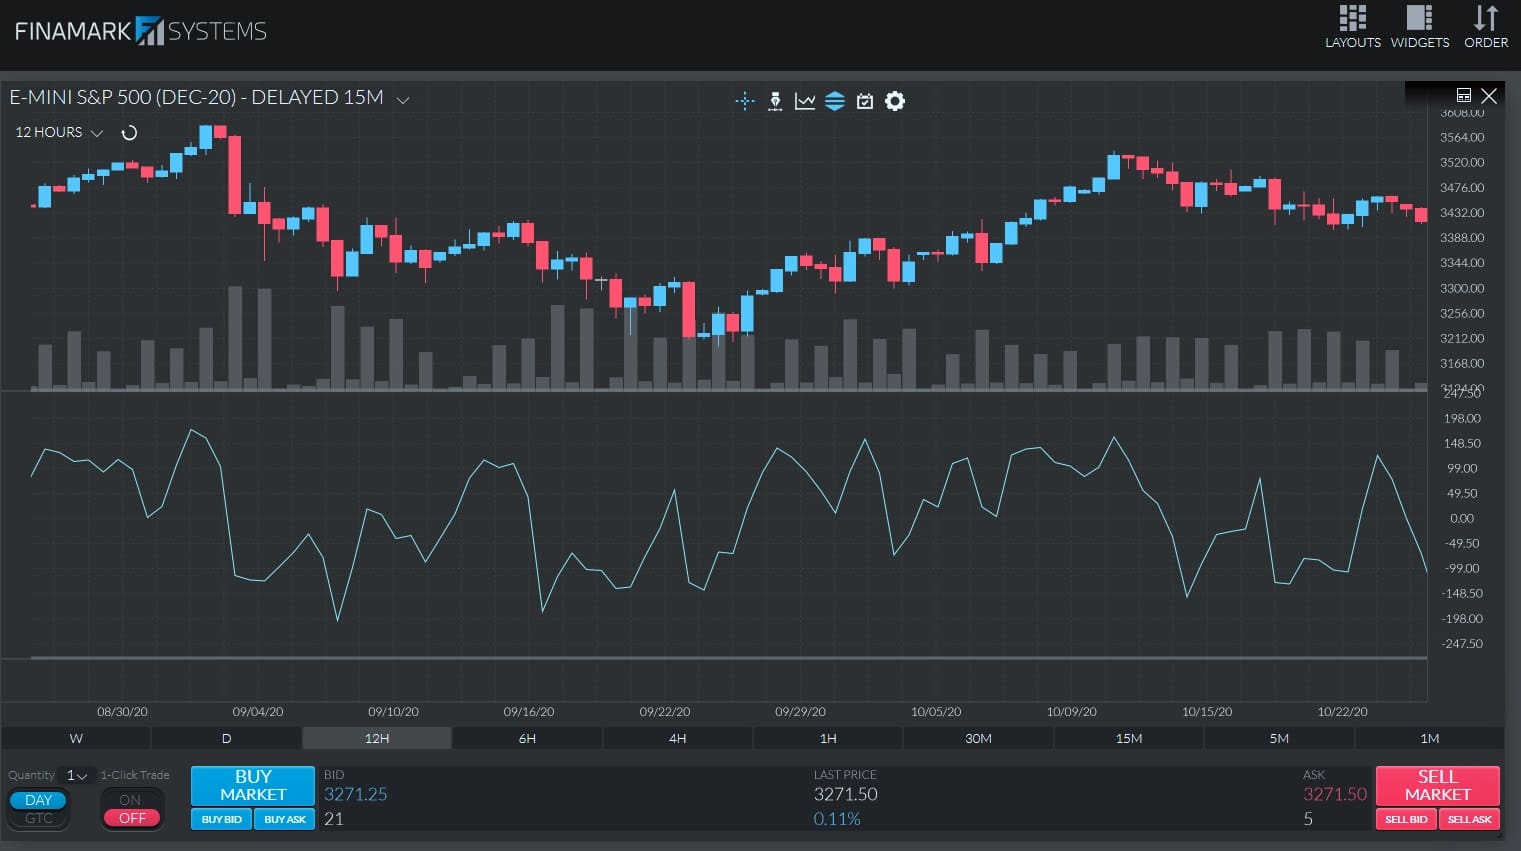
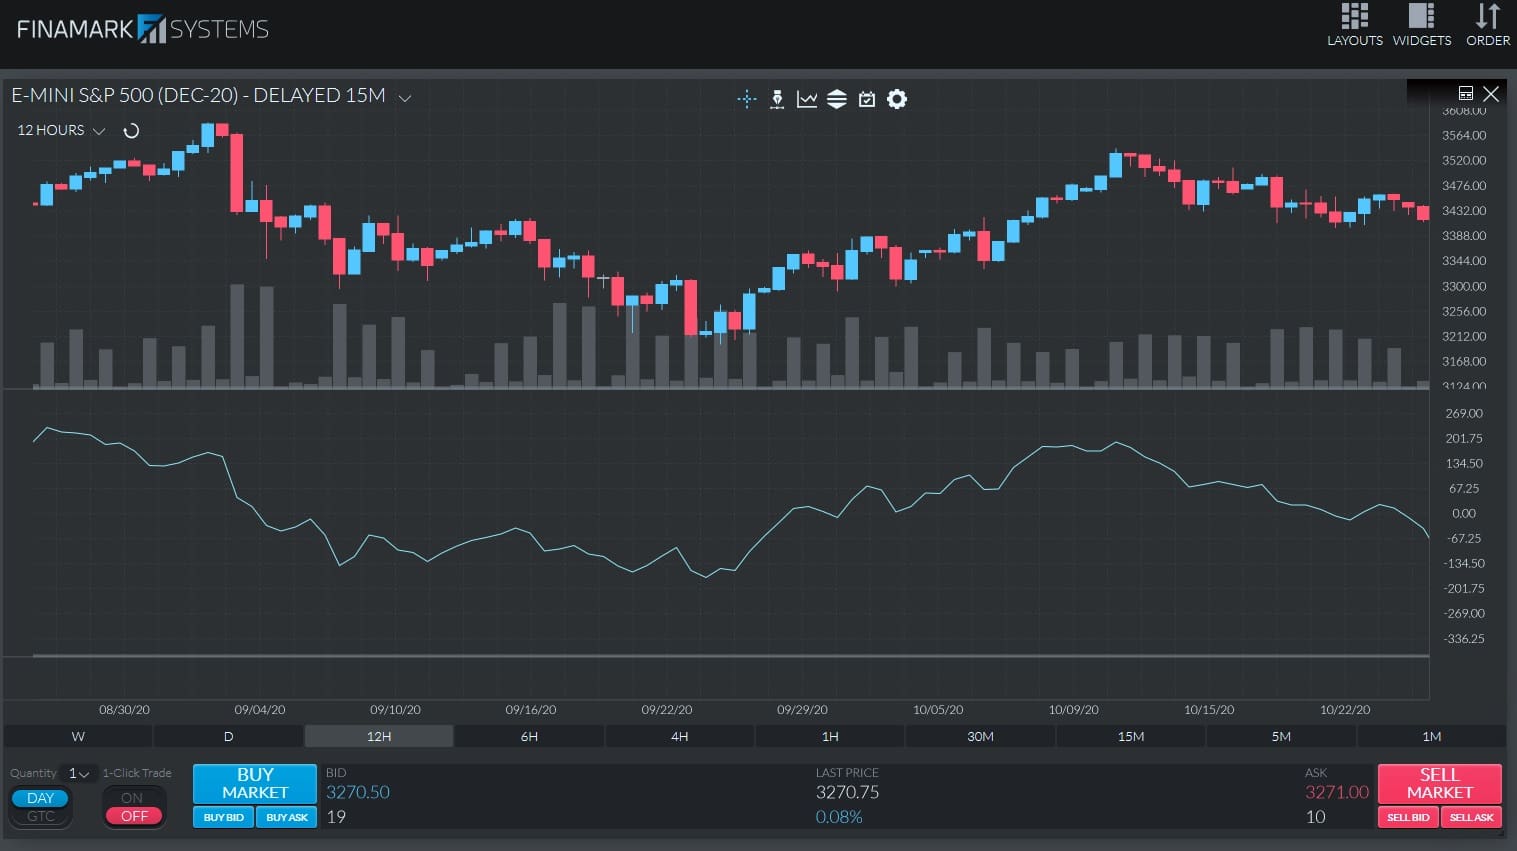
On the chart, the indicator is plotted as a line within a box, fluctuating between -100 and +100.

You might also enjoy:

Commodity Channel Index Calculation and Formula
The formula for the CCI indicator is:
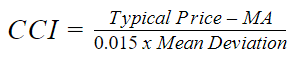
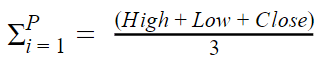
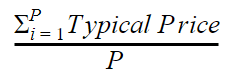
Where Typical Price is:
P is the number of periods and MA is Moving Average.
Moving Average:
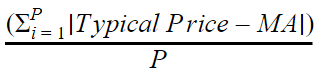
Mean Deviation:
All these formulas and variables might seem a bit confusing and complicated, but the thing is, you don’t have to memorize them. Fortunately, you don’t need to calculate the CCI by hand.
All you have to do is understand the logic behind the indicator to know how it works and how it can help you when trading.
The Theory Behind The CCI, Step by Step
- Define the periods you want to analyze. Usually, the default is 14 periods. If you choose fewer, the indicator will get more volatile. If you define a higher number of periods, the line will get smoother.
- Track the high, low, and close price for each period. That way, you can come up with the Typical Price value.
- Calculate the MA of the typical price. To do that, sum the last 14 Typical Prices and divide them by 14.
- Determine the Mean Deviation for each period based on the formula mentioned above. Sum up all the values and divide them by 14.
- Find the current CCI value by using the most recent Typical Price, MA, and MD. Repeat as each new period ends.
Don’t worry. The charting software for most trading platforms can automatically perform all of the above calculations. All you have to do is set-up the number of periods you want to include.
You might wonder why there is a 0.015 factor in the equation above. The reason is for scaling purposes.
Lambert decided to set the constant to 0.015 to ensure that 70% to 80% of all CCI values will fall between -100 to +100. The exact number that falls within the given range depends on how many periods you’re using.
As mentioned above, using a smaller number of periods will translate to a more volatile indicator, while the more periods used, the higher percentage of values will fall between -100 and +100.
How to Interpret the Commodity Channel Index?
The Commodity Channel Index represents the difference between the current and the average historical price change for a particular security.
High positive CCI values indicate that the current prices are above their average. This is a sign of the trend’s strength.
Low negative indicator values suggest that the prices are below their average. That’s a sign of weakness.
Traders can choose to use the CCI either as a leading or as a coincident indicator.
When used as a leading indicator, the CCI helps recognize overbought and oversold market conditions that might lead to a mean reversion, as well as bullish and bearish divergences, foreshadowing momentum shifts.
On the other hand, when used as a coincident, the CCI signals the emergence of uptrends (surges above +100) or downtrends (dips below -100).
Recognizing Emerging Trends
As mentioned above, 70% – 80% of the time, the CCI will move in a range between -100 and +100. However, during the remaining 20% to 30%, it will be outside those levels. This will indicate an unusual strength or weakness in the current market movement.
Such scenarios are considered a signal of a potential extended move and filter for the current bullish/bearish market direction. When the CCI ranges over the +100 mark, it is considered favorable for the bulls, while when moving below the -100 mark, it is viewed as a bear signal.
In general, when the CCI moves from negative or near-zero territory to surpass the +100 mark, it is considered an indication of the beginning of a strong new uptrend. In these scenarios, traders should look for a price pullback, followed by a rally in both the price and the CCI. Such situations are considered a good buying opportunity, and traders can go long (of course, after confirmation from another signal).
When the CCI moves from positive or near-zero territory to go below the -100 mark, it is an indication that a new downtrend is about to begin. If an additional indicator confirms the signal, the trader can proceed to sell.
Spotting Overbought or Oversold Price Levels
The way traders use the CCI to spot overbought and oversold price levels is based on simple logic. When the indicator is above +100, the price is above its average. When the CCI is below -100, its price is below the historical average.
Alternatively, zones over the +100 and below the -100 marks indicate overbought and oversold price levels. In the former case, when the price moves above +100 and gets back below it, traders take short positions. In contrast, in the latter situation, when the indicator dips below -100 and then gets back above it, traders go long in anticipation of the bullish trend.
Make sure to avoid trading on the first moment when the CCI moves above +100 or dips below -100. The reason is that during strong trends, the overbought and oversold conditions might persist for an extended period that could last for up to several weeks.
This means you shouldn’t anticipate an immediate reversal once the CCI goes above +100 or below -100. Make sure to wait for the indicator to get back below/above the given level and get an additional confirmation before opening your positions.
Bear in mind that the indicator is unbound, which means it can’t generate overbought and oversold signals the same way for each trading instrument. That is why you should always look at the past readings to understand the particular asset’s exact reversal points. For example, for some stocks, the price might reverse near -150 and +250, while for a commodity, these levels might be -300 or +27.
Ensure zoom out and track the CCI back in time to get relevant information for the particular asset.
Bullish and Bearish Divergences
Bullish and bearish divergences occur when the price moves in one way while the indicator moves in the other.
For example, when the price marks lower lows, while the CCI marks higher lows, we have a bullish divergence. On the other hand, if the price and the CCI both go up, but the price marks higher highs, while the CCI marks lower highs, we have a bearish divergence or a signal weakness.
Bear in mind that divergences aren’t the most robust signals since they can last for an extended period and don’t always materialize in trend reversals. However, you can use them as a warning of a potential price change, thus tighten your stop loss or reconsider opening new trades in the trend’s direction.
Understanding How to Use the CCI Indicator
We have already covered the indicator’s specifics: how it is calculated and what it takes into account. By now, you should be aware of its capabilities and limitations.
The most important thing to understand when it comes to using the CCI indicator is that it won’t help if you rely solely on its signals. Just the opposite. It may deceive you or feed you with insufficient information. Make sure always to complement it with other indicators. Doing so will allow you to confirm its signals and make more informed decisions.
Let us go back to an earlier point. As mentioned before, you can use the CCI as a leading or a coincident indicator.
In the former case, it will help you spot overbought and oversold signals. Meanwhile, in the latter case, it will indicate the potential emergence of uptrends or downtrends.
No matter how you use the indicator, though, the essential thing is to make sure you aren’t applying uniform rules blindly without considering the CCI’s specifics. Alternatively, to avoid adopting the same approach as with other indicators.
For example, take into account whether the markets are ranging or trending. This can have a significant effect on the behavior of the indicator.
How the CCI Indicator Works
By analyzing current and past pricing data, the CCI indicator reveals how the instrument’s current trajectory fares to its historical performance.
Or, in other words, whether the price is below or above its average for the particular period and by how much.
The stronger the deviation is, the higher/lower the indicator’s line will be from the zero point. Although most of the time, the line will oscillate around the +100 and the -100 marks. In many cases, it can leave the range and hit much higher/lower values.
Once the line leaves the range, typical for the particular instrument, you get a signal for an overbought or an oversold market.
CCI Indicator Trading Strategies
The most common strategy traders employ when using the CCI indicator is to look when it goes out-of-bounds and gets back.
For example, when the CCI surpasses +100 and then gets back below it, traders open sell positions. In that case, the strong uptrend, indicated by the line’s beating the +100 mark, ends, and the trader expects a reverse market movement.
On the other hand, when it goes below -100 and then moves back above it, traders open buying positions. The idea here is that the pullback marks the bear market’s end and signals a potential reverse market movement.
Of course, you shouldn’t trade on these signals alone. They might be insufficient in many cases.
Traders also combine the CCI indicator with other technical trading tools, including MA, MACD, Parabolic SAR, and more.
Let’s take a look at some examples.
CCI + MA
Combining the CCI with an MA to improve the signals’ quality. The idea of using the MA is to have it serve as a support/resistance line.
Traders open buy orders once the CCI leaves the oversold zone, and the price line crosses the MA from below.
Once the CCI crosses the +100 mark from below and the price intersects the MA in the same direction, traders open sell orders.
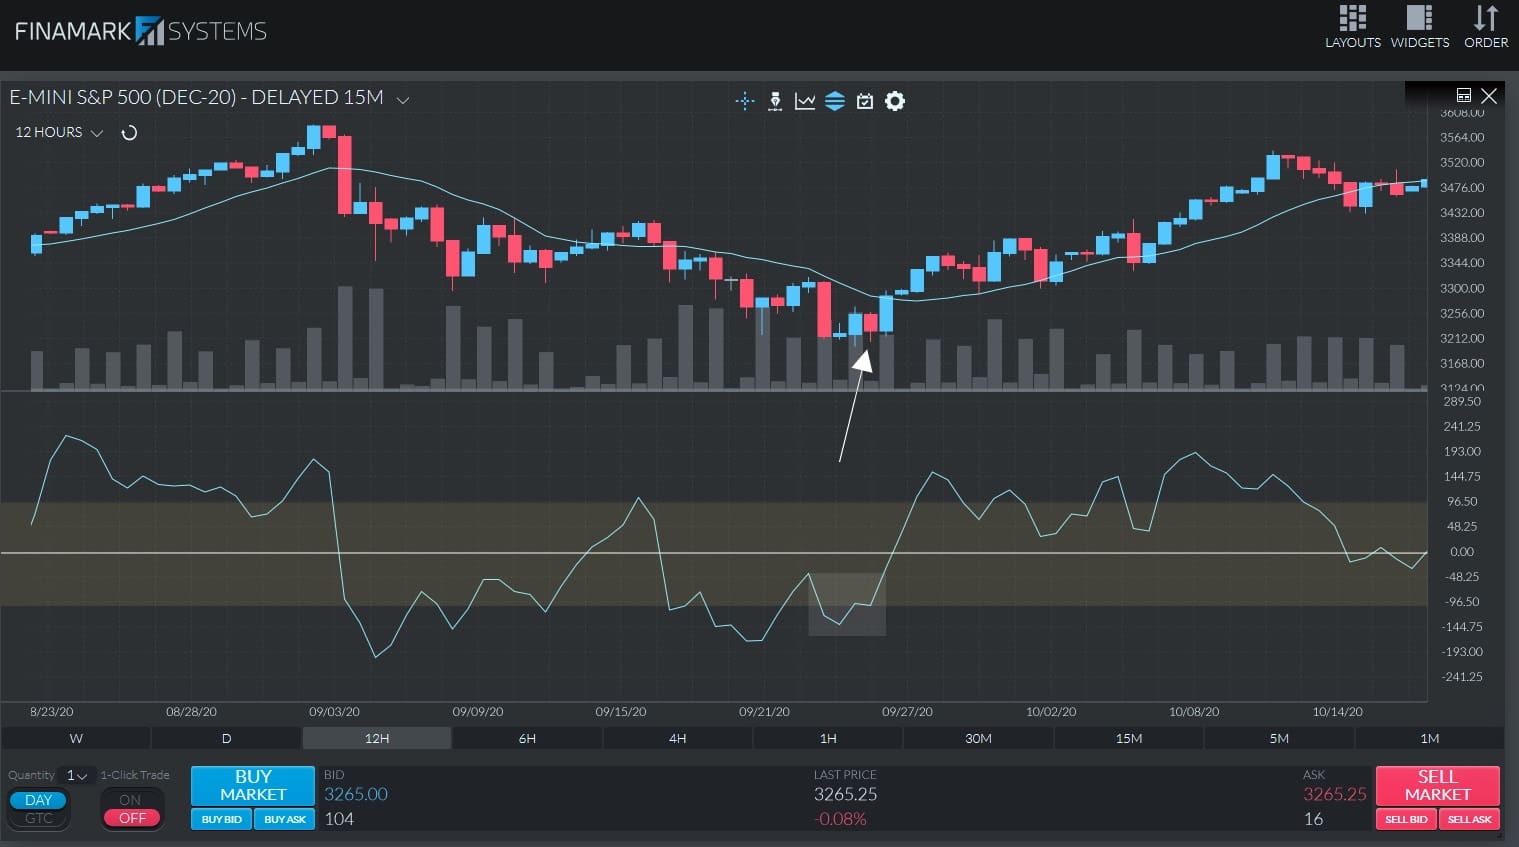
However, it is worth noting that this strategy is better used for short-term trading.
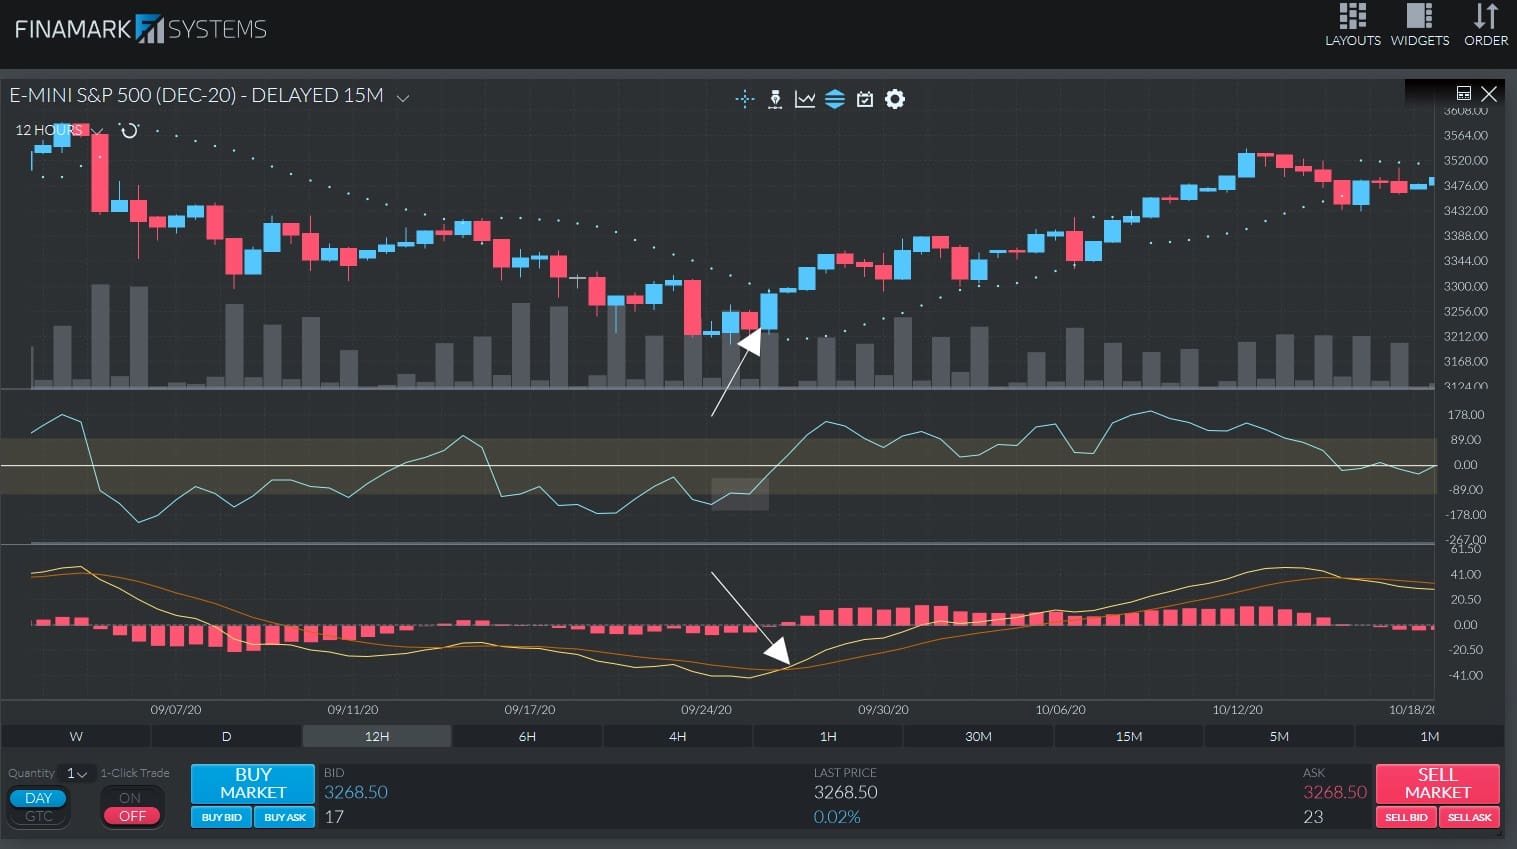
CCI + MACD + Parabolic SAR
A more complex strategy is to combine the CCI with the MACD and Parabolic SAR.
Traders adopting this type of strategy usually open buy orders under the following scenario:
- The Parabolic SAR changes position to go below the chart
- The MACD crosses the line
- The CCI leaves the oversold zone and climbs above the -100 mark
Understandably, once the reverse conditions are met, traders can open sell orders.
CCI Indicator Settings
The standard setting for the CCI indicator is 14. This means it takes price data for the previous 14 periods into account. If you change the variable, the indicator will take the average price changes for the particular number of periods you prefer and compare it to the current price.
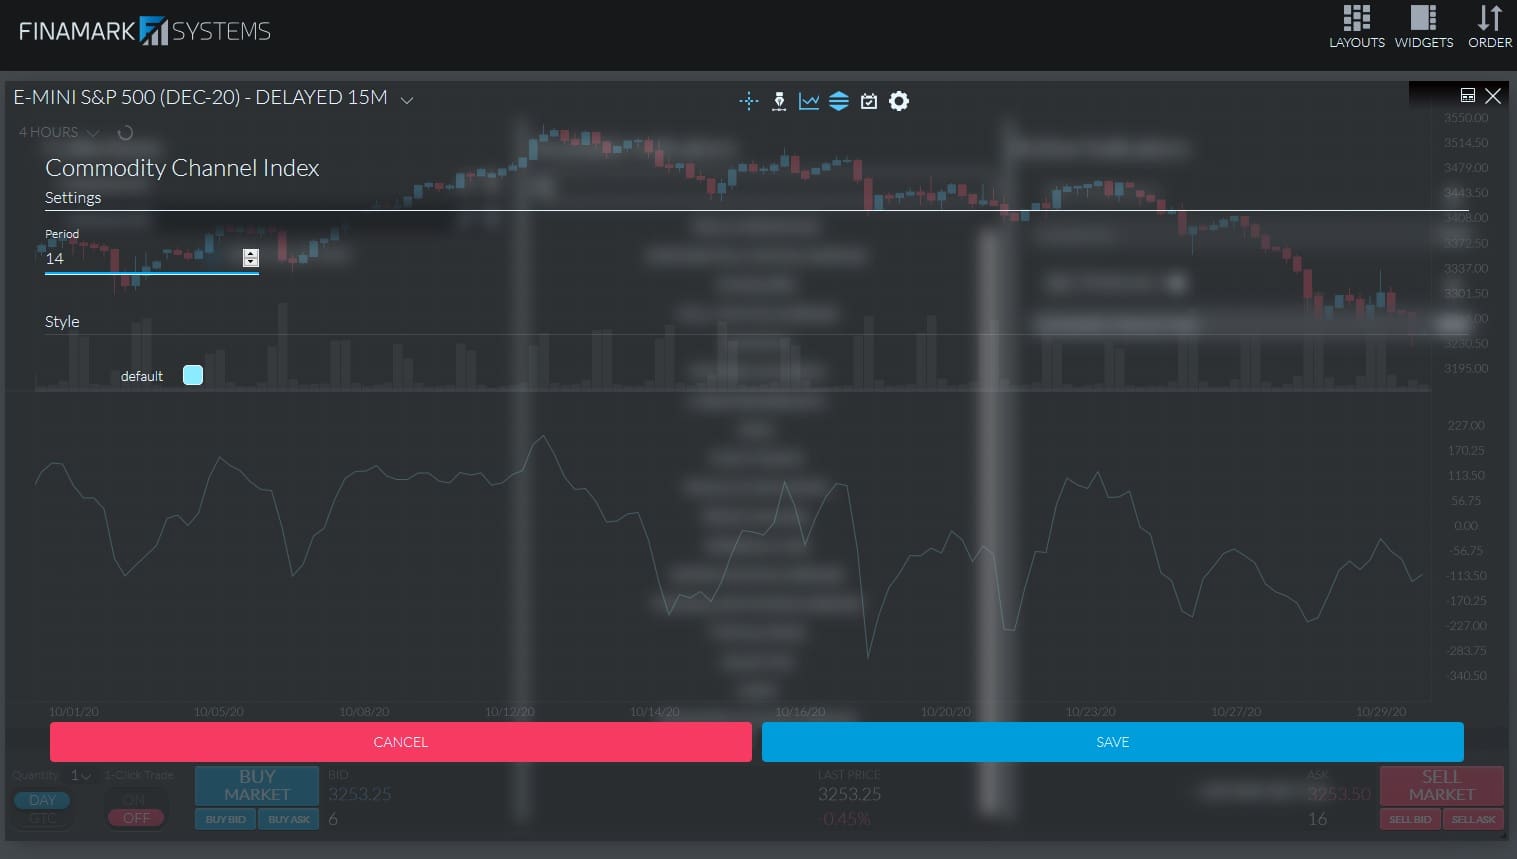
If you set the period to less than 14, the line will get more reactive. Alternatively, it will be more sensitive to price information and fluctuate way more between the boundaries without breaking the lines for too long on either side of the spectrum.
On the other hand, changing the frame to more than 14 periods will smooth the indicator. It will move outside the boundaries only a few times and will remain within range for much longer.
Make sure to avoid changing the settings too often. Otherwise it will end up generating a significant number of false signals.
It is essential to test how your strategy reacts to the indicator’s changes with paper money before applying it within your real account.
What is The Best Signal Offered by The CCI Indicator?
If we should highlight one thing the CCI indicator is best at, it is identifying the strength of the upcoming event.
Many traders trade blindly depending on the CCI’s movement and position in relation to its boundaries (+100 and -100, in the general case). However, we should note that this is all relative. You should avoid using it as your sole reason for placing a trade.
It is better to analyze CCI’s signals in relation to the strength of the current movement. For example, if the line shoots above the +100 mark, consider it an indication of a strong uptrend. And vice-versa, if it nose-dives below the -100, take it as a signal for a strong downward movement.
If there are pullbacks, this means the indicator isn’t as strong, and a potential reversal might be behind the corner.
Advantages and Disadvantages of Using the CCI
As with every technical trading indicator out there, the CCI also has its pros and cons. Let’s take a look at the advantages and disadvantages of the indicator. This will help you understand what you should look for when using it and improve your trading strategy.
Advantages
Works in a variety of markets
When you hear the “Commodity Channel Index” term for the first time, it is natural to think that it is designed to work only in the commodity markets. However, aside from futures, you can also apply it to equities, forex, and a variety of other asset classes. The vital thing to note is that it should be adjusted depending on the traded instrument’s historical characteristics.
Easy-to-comprehend even for beginners
The way the Commodity Channel Index’s design makes it easy to use and interpret even by beginners. All you have to do to use the CCI is to adjust the number of periods you want to analyze. Once you do that, due to the advanced charting features of trading platforms nowadays, you can easily spot when the indicator is out-of-bounds, estimate the signal’s strength, and make a trading decision.
Powerful indicator
The CCI indicator can inform the trader about various market developments. The list includes overbought and oversold price levels, divergences, and emerging trends. It also provides insights into the price momentum and its strength, making it one of the most complete technical trading indicators.
Disadvantages
Overbought and oversold levels are subjective
Due to being an unbound indicator, the CCI can’t guarantee that when it drops below -100 or climbs above +100, it is a fair indication of an oversold or an overbought market. These levels are different for each instrument. This means you should get familiar with the CCI’s historical movement before looking for overbought and oversold signals. Sometimes -200 and +200 might be a better choice. Meanwhile, for other instruments, you might have to switch to -250 and +300, for example.
Shouldn’t be used as a standalone indicator
Although this can be said for practically every technical indicator, we can’t miss highlighting its importance here, as well. Often, beginners learn one or two indicators and try trading solely on them. Such strategies aren’t viable nowadays due to the markets’ complexity. The case is no different with the CCI, so make sure to complement it with other indicators.
Doesn’t take news into account
The indicators take only current price information and compare it to the average mean price for the preferred period. This means fundamental drivers behind these prices are often left out. This may sometimes distort the signals the indicator generates. That is why it is essential to avoid taking the CCI signals for granted. Always look beyond the numbers to seek context and get a fairer representation of the situation.
Final Thoughts
The Commodity Channel Index indicator is a great technical analysis tool to complement your strategy. If used correctly and in combination with other indicators, it can help form a robust trading system. One that is capable of forecasting emerging trends, overbought, and oversold signals.
Think of the CCI indicator as a great “team player” to rely on. It isn’t the superstar that will single-handedly make you an undisputed trading wizard but will contribute significantly to your well-oiled trading machine.