
The difference between the successful and the unsuccessful investor is the accuracy of the information behind their decisions. There are many different methods they can use to get this information. Fundamental analysis is one of the most popular approaches. It’s based on the thorough analysis of financial statements and other official information. These include letters to investors, press releases, analyst reports, etc. The aim is to get a sense of the health and potential of a particular business. This guide will teach you everything you need to know about fundamental analysis. You’ll even learn how to use it to improve your portfolio performance.
What is Fundamental Analysis?
Fundamental analysis is an accounting and financial methodology that focuses on identifying key metrics about a particular company. The goal is to evaluate its viability by looking at its financial statements.
The aim of fundamental analysis is to provide a precise estimation of a particular security’s intrinsic value. Its valuation methodology analyses a variety of different economic and financial factors and the way they affect the performance of the underlying entity. Such factors may include financial metrics regarding assets, liabilities, and earnings, the effectiveness of management, competitors’ performance, macroeconomic indicators such as interest rates, employment levels, GDP forecasts, analyst projections, letters to investors, press releases, news, and more.
The end goal is to find out whether a security is under- or overvalued. For that purpose it examines all relevant data and comes up with a number that investors can compare with its current price. In other words, to provide them with a solid basis to help decide whether or not to invest in a particular asset.
You might also enjoy:
- S&P 500 E-mini Futures Contracts – The Complete Guide
- Oil Futures – The Complete Guide With Specifications

History of Fundamental Analysis
Benjamin Graham is considered the father of fundamental analysis. He’s one of, if not the most important and influential figures in the history of financial markets.
In 1934, in the aftermath of the Great Depression, Benjamin Graham and David Dodd, both professors at the Columbia Business School, published a book called “Security Analysis”. The book warned investors against speculative market behavior and urged them to focus on the intrinsic value of a security.
“Astute observers of corporate balance sheets are often the first to see business deterioration”
– Benjamin Graham, Security Analysis
It wouldn’t be wrong to say that the most accurate and complete answer to the question “What is fundamental analysis” can be found in this book.
The authors proposed the idea of comprehensive fundamental analysis as an effective way to estimate the real value of a particular asset. They also suggest using it as the basis for determining the short-term trends in its future price. However, it is worth noting that Graham and Dodd didn’t focus particularly on long-term forecasts or trying to guess what the exact price of an asset will be at a certain point.
Over 300 pages of the book are dedicated to methodologies for accurate analysis of financial statements. They include both income statements and balance sheets. The chapters include key terms and accounting principles like depreciation, amortization, special items, unconsolidated subsidiaries, and various others.
The book went on to become one of the most cited and important works in the field of financial markets. Almost a century later, Graham and Dodd’s ideas sound just as accurate and important as ever.
The Development of Fundamental Analysis
Right after the release of the “Security Analysis” book, fundamental analysis became the main principle and key methodology for asset valuation. It remained so until the digital revolution took over financial markets. From that point technical analysis and other computational valuation methodologies became more mainstream. Despite the introduction of new technologies that shifted investors’ focus from fundamental analysis, today, it still remains an invaluable part of investors’ preferred tools.
In fact, the essence of fundamental analysis and the key accounting issues discussed in Benjamin Graham’s book were later found present in some of our recent history’s major corporate scandals like the cases of Enron and Valeant Pharmaceuticals.
The core of value investing is fundamental analysis. Warren Buffet is arguably the greatest investor of all time. He built his fortune by adhering to the principles of value investing.
“Other guys read Playboy, I read annual reports.”
– Warren Buffet
The interesting fact here is that although Benjamin Graham was Buffet’s mentor, he wasn’t a successful investor. The reason was because Graham was interested in whether a company was capable of generating enough revenue to help it overcome issues that could decrease its price in the first place. Buffet took this concept further and improved on it by looking at the long-term situation. This is where the term “value investing” comes from – Buffet was interested in whether the current situation and the circumstances around a particular business can prove valuable in the future and help it outmuscle its competitors.
Fundamental vs. Technical Analysis
Fundamental and technical analyses are the two basic pillars of investment philosophy and leading schools of thought when it comes to financial markets theory. Both are very different and often oppose each other, which is why there is an ever-lasting debate between fundamental and technical analysis.
While both analysis methods are intended to help investors research and project the future price of a particular asset, they differ from each other in terms of they’re applied and the tools they use to come up to a conclusion.
While fundamental analysis tries to estimate the intrinsic value of an asset by relying on data from financial statements, official statistics, and more, the technical analysis makes forecasts based on only two factors – the asset’s price and its trading volume. Technical analysts use graphs to find patterns and anomalies formed by the share’s price and trading volume, which they interpret as buy or sell signals.
In reality, technical analysis doesn’t focus on intrinsic value. What it does is try to simplify the concepts of fundamental analysis by assuming that all crucial indicators needed to make an accurate forecast are already factored into the asset’s price. To forecast price movements, technical analysts employ a variety of tools including support and resistance, momentum-based indicators, moving averages, and trend lines.
Investors who base their trading decisions on the intrinsic value of an asset (long-term investors, value investors, etc.), usually prefer fundamental analysis as the primary research methodology. Day-traders, speculators, arbitrage traders, or short-term investors, on the other hand, prefer technical analysis. It gives them a quick and timely forecast of the short-term price movements they’re interested in. Some market participants, on the other hand, try to combine both methodologies to make a more accurate forecast about long-term opportunities.
Main differences between fundamental and technical analysis
| Fundamental Analysis | Technical Analysis | |
| Function | More suitable for investing | More suitable for trading |
| Used By | Long-term investors looking for intrinsic value in an asset | Traders interested in short term price movements |
| Objective | Determine whether the asset is overvalued or undervalued | Find the best moment to enter or exit the market |
| Application | Mainly stocks, but also works for bonds, derivatives & more | All asset classes |
| Information | Financial statements, balance sheets, press releases etc. | Price and trading volume |
| Analyzed Time | Long periods (years or decades) | Short periods (hours, days, etc.) |
| History | First proposed in 1934 | First proposed in the 18th century |
Understandably, both methodologies have their advocates and opponents. The truth is that both are useful for different purposes. For this reason neither can be said to be better, and there is no right answer to the fundamental vs. technical analysis debate. In reality, combining them is never a bad idea – it can even improve the accuracy of your forecasts.
Types of Fundamental Analysis
There are two types of fundamental analysis – top-down and bottom-up. To get a quick understanding, think of the top-down approach as the global one and of the bottom-up as the local one.
Top-Down Approach
It is focused on macro factors like the state of the economy, GDP forecasts, unemployment level, interest rates, etc. By taking all these factors into account, the investor tries to make a forecast about the broader picture – the overall direction of the economy and general market trends. Once you do that you’ll be more aware of the sectors and industries that will thrive and those that may not be a solid investment opportunity. You can then take it one step further and perform the analysis on a corporate level to identify high-potential stocks.
The idea here is to narrow down the investment horizon by starting from the global picture and shifting towards individual stocks.
Bottom-Up Approach
As the name suggests, the bottom-up approach inverts the pyramid and starts analyzing the situation from a micro level. Investors who prefer this methodology believe that the overall state of the economy may not be indicative of the performance of particular stocks. They think that some shares may have high-investment potential, although being a part of a stagnating sector or industry.
Bottom-up fundamental analysts focus on corporate earnings, financial statements, balance sheets, press releases, letters to investors, supply and demand estimations, goods and services offered by the business, and other company-specific sources of information.
Both types of fundamental analysis have their pros and cons. For example, top-down investors focus mainly on identifying the well-performing sectors and industries. That way, they can narrow down the universe of potential opportunities and quickly shift between the analysis of specific companies. Bottom-up analysts, on the other hand, get a clearer understanding of a particular company and its operations.
The truth is that no approach is better than the other. Both types of fundamental analysis are suitable for different situations and appeal more to different types of investors. The top-down approach, for example, is preferred by beginner investors or those who lack time to make in-depth financial calculations on a micro-level. The bottom-up approach, on the other hand, is preferred by investors who seek high-potential stocks capable of outperforming the market, even in turbulent periods.
Other Methodologies
Before we move to the section where we discuss how to do fundamental analysis, we should note that some experts single out some additional fundamental analysis approaches. In the book “A Complete Guide to the Futures Market: Technical Analysis, Trading Systems, Fundamental Analysis, Options, Spreads, and Trading Principles” (link), Jack Schwager and Mark Etzkorn mark down the “old-hand” approach. According to them, this approach is used by analysts who are perfectly familiar with the market they invest in (the authors describe these professionals as having “a virtual sixth sense with respect to price fluctuations”).
Balance tables are another methodology proposed in the book. They compare current season supply and changes from prior seasons. They also introduce the analogous season where analysts compare past seasons with similar fundamental characteristics to the current one to build a road map for forecasting price swings. Schwager and Etzkorn also talk about regression analysis as a statistical procedure to generate forecasts based on the analyzed data.
It is worth noting, however, that as a starting point in fundamental analysis, the top-down and bottom-up approaches are everything you need to know. If, at some point, you want to up your game, go ahead and refine them with some additional methodologies proposed in the literature.
How to do Fundamental Analysis
It is clear that we can’t provide the full answer on how to do fundamental analysis in just one guide. The truth is that there are thousands of written pages all by famous investors and key industry figures like Warren Buffet, Benjamin Graham, etc. which dive deeply into the principles of fundamental analysis and how to apply them to improve your investment performance.
What we will do, however, is to show a practical implementation of the top-down and bottom-up investment approaches. So, here are some useful tips on how to do fundamental analysis via the top-down and bottom-up methodologies:
How to do Fundamental Analysis via the Top-Down Approach
As we have already said, the top-down approach focuses on the broader picture. That is why to do a proper analysis, we need some macroeconomic factors that can help determine the overall direction of a particular sector or industry. From there, based on the belief that stocks in well-performing industries should also be doing well, we can look at a micro-level and identify particular picks.
Macroeconomic Indicators
To get started, we should identify as many macroeconomic factors as possible. This will expand our horizons for many industries later on. A good idea is to collect information about the GDP projections for the US and the global market, the outlook for the interest rates, the bond prices and yields, the inflation levels, the prices of different commodities, and more.
If we take the interest rates indicator, for example, a good sector to look into is the financial one. Banks’ primary income comes from interest rates on loan products, so we can track the movement between a financial market index (for the example below we use the Financial Select Sector SPDR ETF, XLF) and the 10-year Treasury yield as a benchmark for interest rates changes.
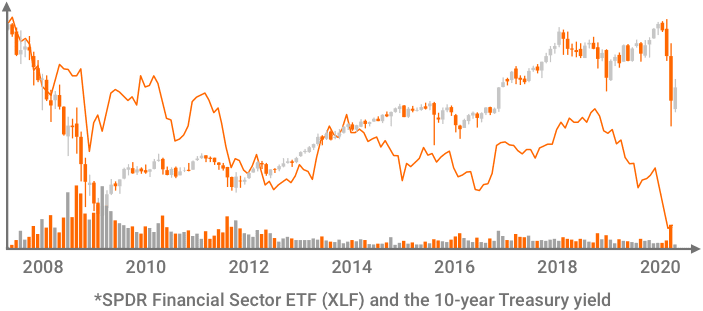
The graph visualizes what appears to be a straight correlation between both instruments. When the interest rates rise, bank stocks tend to perform well. It is worth noting, however, that this isn’t always true, and such an analysis should be complemented with additional factors like the overall state of the economy. If, for example, the economy isn’t performing well when interest rates are rising, banks’ stocks may also struggle.
Similarly, we can use interest rates as a crucial factor for the analysis of home building and construction material producing companies. When the interest rates are low, then home loans become more affordable. This leads to more demand and a boom in the construction sector.
Commodity Examples
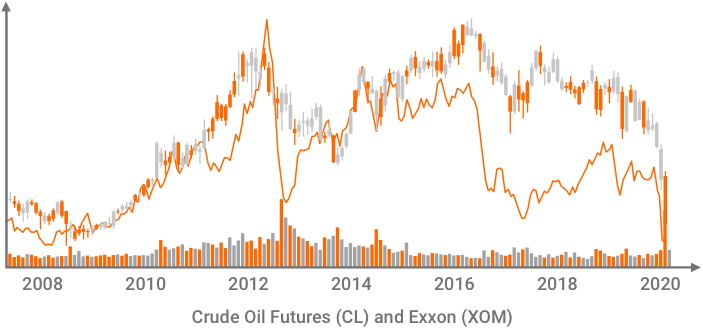
When it comes to commodity prices, an easy example is to look at the price of oil and companies involved in the oil production business. The correlation is positive, and the trend in the oil prices almost always tells you the share prices of oil-related companies. In the example below, we compare the price of the Crude Oil Futures contracts (CL) and the share price of the Exxon Mobil Corporation (XOM). What becomes clear is that spikes in the price of the commodity always leads to spikes in the share price of the company.
The top-down approach can be applied to country- or region-specific stocks by taking into account the local GDP projections, the unemployment levels, the economy’s health, and other factors.
How to do Fundamental Analysis via the Bottom-Up Approach
When investors apply the bottom-up methodology, they don’t take into account the general market trends and the macro factors, initially. Their sole focus is the stock-specific fundamentals which help make a comparison with other companies within the same industry.
But what exactly are stock fundamentals? We can separate them into two categories – quantitative and qualitative. The difference is that while the former can be measured in numerical terms, the latter is measured by abstract factors like quality or character. Let’s take a look at both.
Qualitative Fundamentals
Qualitative fundamentals are less tangible and are hardly measured by values for size, quantity, or volume. Here are the most popular qualitative factors:
Business model and competitive advantages
This fundamental characteristic defines what the company does and how it stands out from the competition. This is a subjective factor that can’t be measured by any ratios. Understandably, businesses with compelling competitive advantages are investors’ favorites.
Management
According to the majority of analysts, this factor is the most important one. The quality of the management team and its style are detrimental to the performance of a particular company’s shares. History is full of examples of how badly managed companies can’t live to their potential and fail. To get a sense of the management of a particular business, it is always a good idea to research the biographies of the team members and find out how they have performed in their previous jobs.
The power of the brand
No investor will doubt the power of brands like Nike, who managed to build a community of engaged customers. This is very important when making forecasts about the performance of a particular business in times of stress, a weaker economy, aggressive competition, etc., as well as its sales growth. Companies with stable brands have the potential to overcome exterior risk factors and even progress in hard times.
There are plenty of other qualitative factors that can be taken into account. Such include the industry-wide growth, the regulatory framework in the particular industry, the competition and its behavior, the customer base, proprietary technology, patents, market dominance, and more.
Quantitative Fundamentals
Think of them as hard numbers or measurable characteristics of a particular company. In estimating the intrinsic value of a stock, the bottom-up approach employs a variety of tools, including financial ratios, growth metrics, and more. Here are the most popular ones:
Earnings-per-Share (EPS)
The EPS ratio reveals the degree of profitability of a particular business. It indicates the amount of profit that it allocates to each share. A higher EPS ratio means the company is better performing and more profitable, thus – a good investment opportunity.
Price-to-Earnings (P/E)
The ratio reveals the number of corporate payouts compared to the stock price. Think of it as the salary for a job position – it indicates whether the stock pays well compared to what it takes (its price). Good investment opportunities usually have lower P/E.
Too high or too low P/E means the stock is either overvalued or undervalued, and its price will soon be corrected.
Price-to-Book (P/B)
The P/B ratio reveals how much the stock is worth compared to the book value of the business. A P/B higher than one means the market believes the stock might grow faster than its book value indicates. When calculating this ratio, don’t be surprised if you end up with numbers in excess of 100 or more. This is normal for growth stocks.
Return on Equity (ROE)
ROE is among the most popular and widely used fundamental indicators. What it does is reveal the level of efficiency of a company when using the shareholders’ equity. A higher ROE means the business is more efficient.
Beta (β)
The Beta is a crucial indicator to use if you want to find out the correlation of a particular stock with the movement of the sector it belongs to. To derive the value of the Beta, investors compare the stock to a benchmark – usually an index. The Beta’s value varies between 1 and -1, but in some cases, may exceed them.
- Covariance – the stock’s return relative to the one of the market
- Variance – how the market moves in comparison with its mean
If the β < 0, then the stock has a reverse correlation with the benchmark. The lower the value, the higher the negative correlation is. Lower Beta means lower volatility and profit potential. If the β > 0, then the share’s price correlates with the benchmark. A higher Beta doesn’t only mean a higher correlation, but also higher volatility and higher profit potential.
Projected Earnings Growth (PEG)
The idea of this indicator is to help you discover how much you will pay per unit of expected earnings growth. In that case, even stocks with high P/E and high PEG can be defined as good investment opportunities.
The PEG ratio builds up the P/E ratio by adding an additional parameter like the EPS growth. Doing so makes it more complete and allows for more accurate projections. The PEG reflects the real value of a stock, which helps investors easily find under- and overvalued assets.
Dividend Yield and Dividend Payout Ratio
Value investors like Warren Buffet or investors who prefer dividend income use this indicator as a main tool for quantifying the potential of a particular investment opportunity. The indicator reflects the percentage return the business pays its shareholders as dividends.
To add an additional dimension to dividend estimations, investors also consider the Dividend Payout Ratio indicator. The calculated values, though, don’t have a straightforward interpretation. You should analyze them in relation to other information or metrics.
Let’s say that DPR is calculated at 20%. This value, on its own, doesn’t say much. For example, growing companies tend to retain a significant part of their profits and reinvest them to fund their expansion. This means they are paying little to no dividends. Companies paying higher dividends, on the other hand, may be mature businesses with limited growth potential.
There are plenty of other fundamental analysis metrics to use and covering every single one will turn this guide into a textbook. What we are trying to do here is to introduce you to the world of fundamental analysis and its main tools. This will help you further navigate the investment world and build upon your knowledge base.
Fundamental Analysis Tips and Tools
At this point we should be familiar with what fundamental analysis is and how it works in practice. Now it’s time to focus on some fundamental analysis tips and tools that can help you streamline the process.
As we know, the most important thing for a proper fundamental analysis is to get our hands on official corporate data. Public companies, for example, publish their financial statements and letters to investors on their websites. Private businesses, however, aren’t required to do so, so often, it is hard to obtain any information about them. To overcome this problem, you can take a look at tools like Powrbot where you can find corporate information for free.
If you want some charting features and to visualize the performance of a particular stock over time, then TradingView will do the job for you. If you have a more advanced understanding, you can even explore the variety of built-in technical indicators.
SimplyWallStreet is another excellent tool to help you do the math behind stocks’ valuation. The platform calculates ratios and metrics and presents the results into easy-to-digest infographics and charts. The software makes fundamental analysis easy and accessible even by beginners.
If you are looking for a software that combines most of the things you need for a proper fundamental analysis, then you can give Finviz a shot. It is a stock screener, heat map provider, news compiler, and more. You can use it to estimate the correlation between different stocks or assets. It helps you get notified about important events that can move the price. You can also simply use it to do research.
Platforms
The tips and tools section of this guide wouldn’t be complete without mentioning trading platforms. Many of the leading brokers have well-developed and highly-functional platforms. These are often free to use and suitable for fundamental, technical, and quantitative analysis. Such an example is TD Ameritrade and its Thinkorswim platform.
Bear in mind that fundamental analysis doesn’t have to be made from the ground up. Especially not when you are making your first steps in trading. There are tons of analysis available on the web which you can start with. A great idea is to read an overview of different industries to get familiar with how those economic sectors work. Doing so will teach you what drives the price of the stocks of companies operating there. SeekingAlpha, for example, is a great starting place and a source of invaluable industry analysis and reports. You can even use Twitter to follow leading fundamental analysts to stay up-to-date with their recommendations and stock picks.
To conclude
Fundamental analysis is a vital ingredient of the financial markets’ reality nowadays. Today the days of romantic long-term investing seem to be gone. Instead, investors are seeking short-term profits and ways to exploit momentum trading opportunities. Fundamental analysis still plays a crucial role in the strategies of the most successful investors. In the end, learning the tricks of fundamental analysis is worth it, even if it takes you more time. If you aren’t sure, just look at Warren Buffet’s net worth.