
Last Updated on September 8, 2023
At first glance, the Ichimoku Cloud chart may seem like a piece of abstract art given all the colored squiggly lines and spaces. Once you become acquainted with its interpretation, however, you’ll quickly realize that it is relatively straightforward. It may even end up becoming one of your favorite tools in your trading arsenal. This beginner guide explores the basics of the Ichimoku Cloud indicator. We’ll take a closer look at how to use it and identify ideal market entries and exits, and understand its formula and settings for your trades.
What is the Ichimoku Cloud?
Also known as Ichimoku Kinko Hyo, the Ichimoku Cloud is a popular and flexible technical analysis instrument. It’s part of the trend indicators category. As with all trend indicators, the Ichimoku Cloud is concerned with identifying the direction and reversal points of prevailing market trends. It displays support and resistance levels, the trend direction, and gauges momentum for a traded asset.
In Japanese, Ichimoku Kinko Hyo means ‘one look equilibrium chart’ or ‘instant look at the balance chart.’ That’s an apt description. Traders can easily identify market trend directions and potential buy/sell signals with just one look at the Ichimoku chart.
This indicator can also work as an oscillator. You can use it to gauge the speed of price action for a particular asset. All in all, the Ichimoku Cloud is famous for being a one-stop tool that makes for a viable foundation for any trading strategy.

You may also like:
A Brief History
The Ichimoku Cloud indicator’s inventor was Goichi Hosoda. At the time, he was a little-known Japanese journalist dutifully covering Japan’s rice markets. He was extremely talented, especially when it came to understanding price movements and how they reacted at certain areas of a chart. These unique price reactions are what we call Support and Resistance levels today.
Goichi began working on the Ichimoku indicator in 1930, along with several students. He tasked them to run endless computations and scenarios in a bid to arrive at an “all in one” indicator for evaluating financial markets more efficiently. It took him over 35 years to refine his creation before finally publishing it in 1969.
After its public release, the Ichimoku Cloud quickly became the most frequently used indicator in the Japanese financial markets. However, it only gained exposure in the west in the late 1990s. The main reason for the delay was a lack of translation or in-depth understanding of the tool.

Ichimoku Calculation and Main Lines
To utilize this powerful indicator, it’s important to first understand the five main lines on the standard Ichimoku Cloud chart and what they represent. To make things easier, we’ve included the English translations in parentheses in the titles.
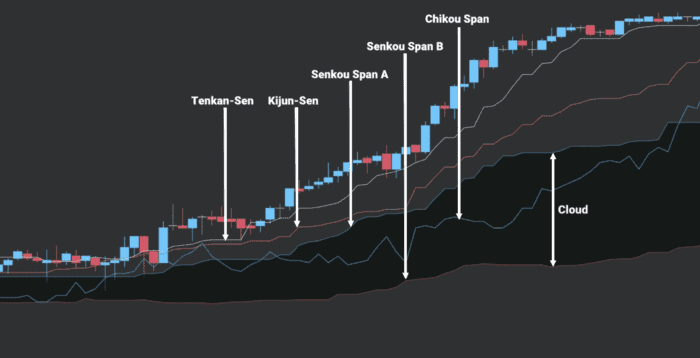
1. Tenkan-sen (Conversion line)
The Tenkan-sen (Conversion line) is calculated by adding the highest high and lowest low values over the last 9 periods, divided by 2.
Formula:
(9-period high + 9-period low)/2
While it is somewhat similar to the Simple Moving Average (SMA), Goichi believed that it was more important to focus on price action and its extremes instead of smoothing data over a given period. That’s because price action indicates the market entry point. In this way, the Conversion line mirrors price better than moving averages.
2. Kijun-sen (Base line)
The Kijun-sen (Baseline) represents the overall trend for a traded instrument or a pair (in the case of Forex). It is derived using the same formula as the Conversion Line by considering the price action of the highest high and lowest low. But instead of the last 9 periods, it examines the last 26 periods and then divides them by two.
Formula:
(26-period high + 26-period low)/2
The focus is on 26 periods. That’s because when Goichi first created the Ichimoku Cloud, the Japanese markets were operating on a 6-day per week basis. This meant that there were 26 trading days in a month. Therefore, the Kijun-sen (Baseline) essentially tracks the price action highs and lows for the last month. However, it can also be any 26 periods depending on the chart view. This can be 26 hours, days, weeks, even months.
3. Senkou (Leading) Span A
It’s formed by adding the Tenkan-sen (Conversion Line) to the Kijun-sen (Baseline) and dividing the total by two. This calculation is done for the 26 periods ahead.
Formula:
(Tenkan-sen Line + Kijun-sen Line)/2
The Senkou (Leading) Span A forms one of the two boundaries of the Ichimoku Cloud. It is plotted 26 periods in the future, so it has some predictive qualities based on momentum.
Essentially, the first portion of the Ichimoku Cloud (also known as Kumo) is based on the evolving price action lines. These are half-trend, half-momentum. Put together, you’ll get the Span A, which continually changes due to the acceleration or deceleration of price movements.
4. Senkou (Leading) Span B
This line is calculated by taking the highest high, adding it to the lowest low over the past 52 periods, and dividing it by two. Similar to Senkou (Leading) Span A, this calculation is done for the 26 periods ahead.
Formula:
(52-period high + 52-period low)/2
Senkou (Leading) Span B forms the other edge of the Cloud on a price chart for a given asset. Together with Senkou (Leading) Span A, the Cloud helps identify support and resistance areas for future trades.
It’s based solely on the asset’s price action over the last 52 candles, depending on the time period used in the chart. For example, if you’re using a daily chart, then you’ll be considering the last 52 days. Alternatively, if you’re using the one-hour chart, you’ll need to consider the price action over the last 52 trading hours.
5. Chikou (Lagging) Span
This line is calculated by plotting 26 days back, hence the name “lagging” indicator. The previous 26-period closing prices are drawn on the latest 26 trading periods. It is simply used to indicate any possible support and resistance areas on the chart. Some traders prefer not to use the Chikou Span since it is based on historical data.
However, it can come in handy in tracking the prevailing market trend and the current price momentum. It can therefore be a viable measure of market sentiment.
How To Use The Ichimoku Cloud
Now that you have an idea of the lines and areas that make up the Ichimoku Cloud let’s look at what the signals mean in trading. Here’s what to keep in mind after plotting Ichimoku on the chart of the asset you’re trading:
- When prices are below the Cloud, it means that the market is in a downtrend. Alternatively, prices above the Cloud signify a market that’s trending upwards. Keep in mind that there’s the possibility of a trendless period when the price is stuck within the Cloud. This area is known as a noise zone, and it may be prudent to avoid taking any positions when in this area.
- When Senkou (Leading) Span A goes upward and above the Senkou (Leading) Span B, then there’s growing bullish momentum in the market. This indicates a buy signal. On the flip side, a downward trend in the Senkou (Leading) Span A and when it drops below Senkou (Leading) Span B indicates bearish momentum. This is generally a sell signal.
- When the Tenkan-sen (Conversion line), Kijun-sen (Baseline), and the asset price are all above the Cloud, and the Tenkan-sen (Conversion line) crosses the Kijun-sen (Baseline) from above, that’s a buy signal. The reverse is when the Tenkan-sen (Conversion line), Kijun-sen (Baseline), and the price are all below the Cloud.
Other Strategies
One key strategy is to look for thinner Cloud formations on the chart as they usually offer a glimpse into an approaching reversal. The good news is that since you plot the Cloud 26 periods ahead, you typically have plenty of time to spot the reversal window. As you may know, spotting and timing a reversal is one of the hardest things to do when trading. This is when the Ichimoku Cloud comes in handy.
To maximize the effectiveness of this indicator, consider using it alongside other key technical analysis tools. For example, the Relative Strength Index (RSI) can help confirm the particular direction of given market momentum.
Ichimoku Cloud Settings
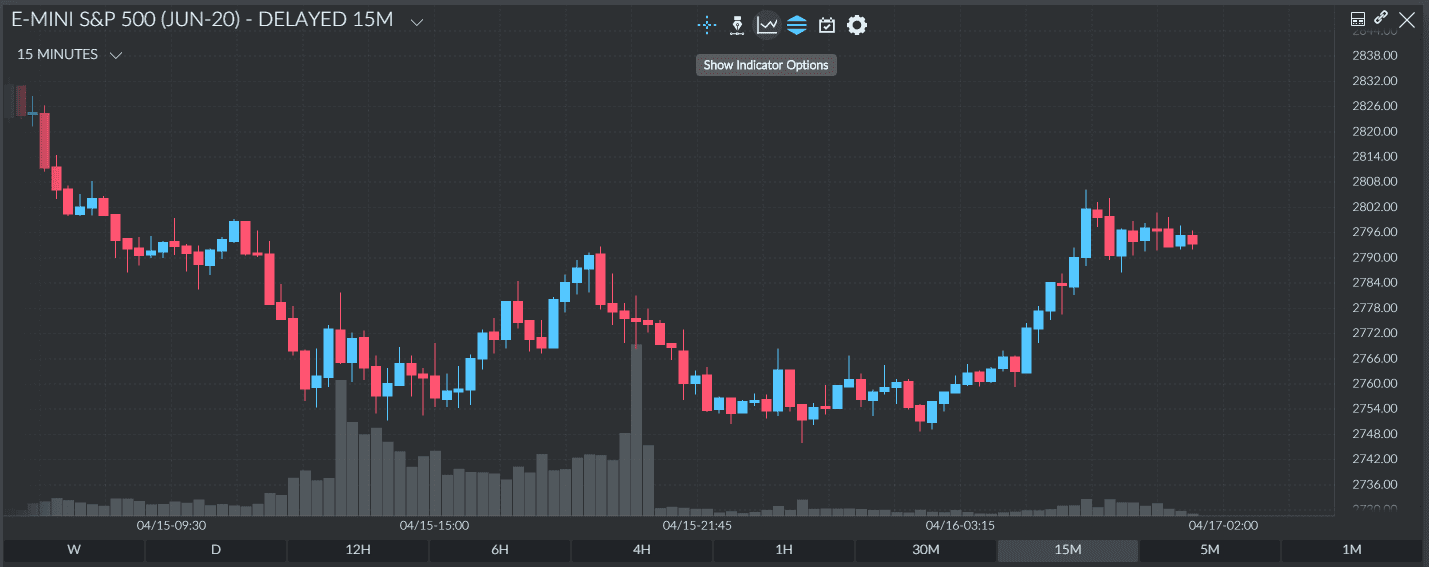
The process for setting up the Ichimoku Cloud on a chart will typically depend on the platform that you’re using. For instance, if you’re using Finamark, then it’s a simple matter of clicking the Indicator Options icon in the top-middle of your charts.
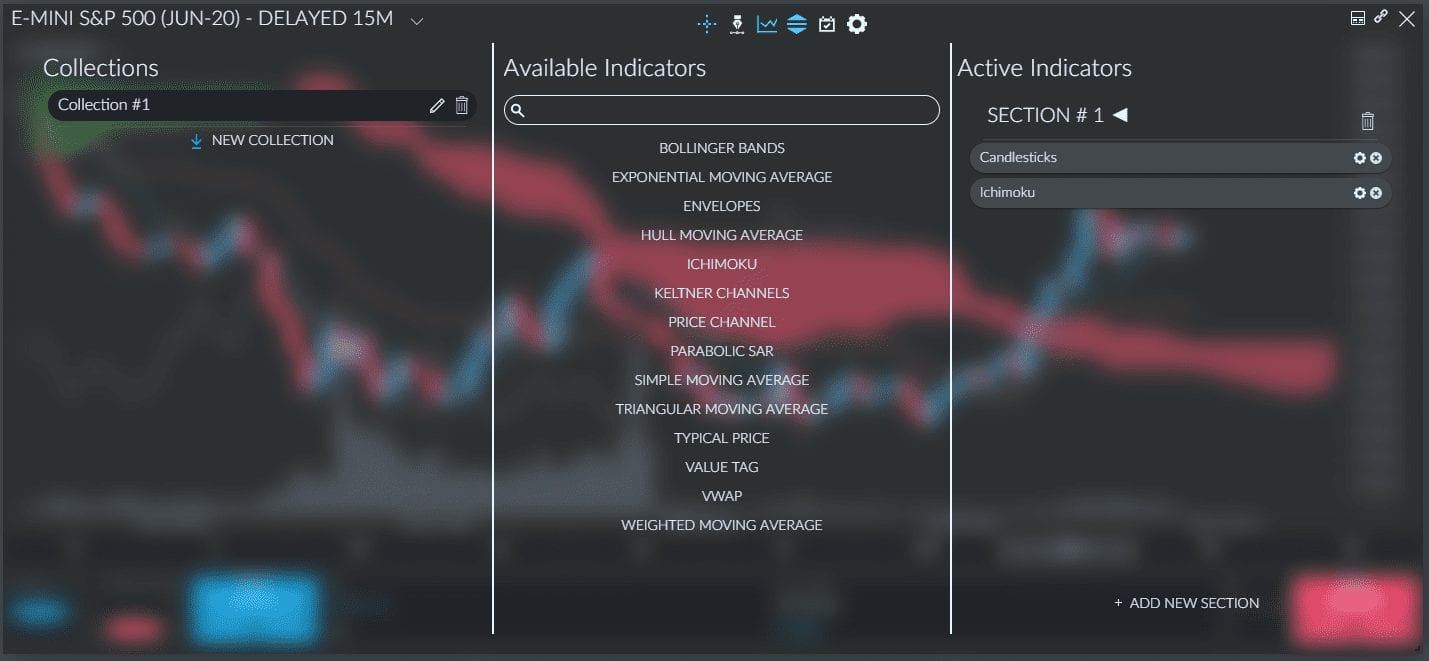
Select your collection on the left, then click Ichimoku in the available indicators column in the middle. This’ll add it to your list of active indicators on the right.
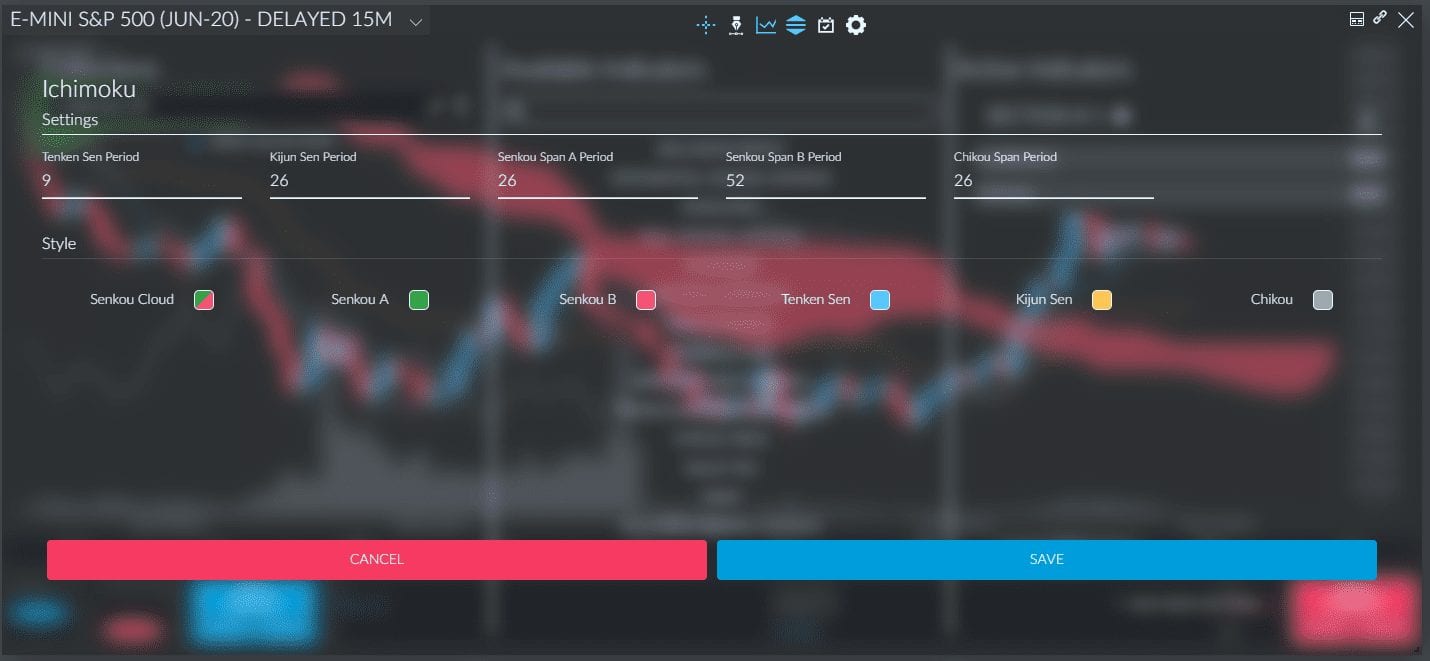
Once it’s added to your active indicators, you can even customize the line colors and time periods as you see fit by clicking the gear icon. Be sure to keep the default settings if you’re just starting out with this tool.
Many other trading platforms should have this well-known indicator as well.
Final Thoughts
This Ichimoku Cloud system is a great tool for helping identify ideal buy and sell signals. It also helps with spotting corrections and getting a general overview of market sentiment. When used properly, it can serve as a fantastic way to improve the risk-reward ratio for your trades and essentially augment your trading style.
That being said, remember that this guide is only a starting point for understanding how to utilize this powerful indicator. As such, you should remain committed to continuous learning and keep accumulating knowledge on the best way to execute your trades.


Thankyou
Thank you, Thanzar! We are always working on creating more valuable information for our traders 💪 Make sure to follow us on our Facebook , Instagram, Twitter and Youtube to stay updated 😉