
Last Updated on March 29, 2024
Keltner Channels are a series of volatility-driven indicators shown above and below an instrument’s price. These channels are particularly versatile for traders. They help traders identify potential price breakouts, overbought, and oversold conditions by graphically revealing an instrument’s volatility. Keltner Channels’ basic description may sound mundane, but its application isn’t.
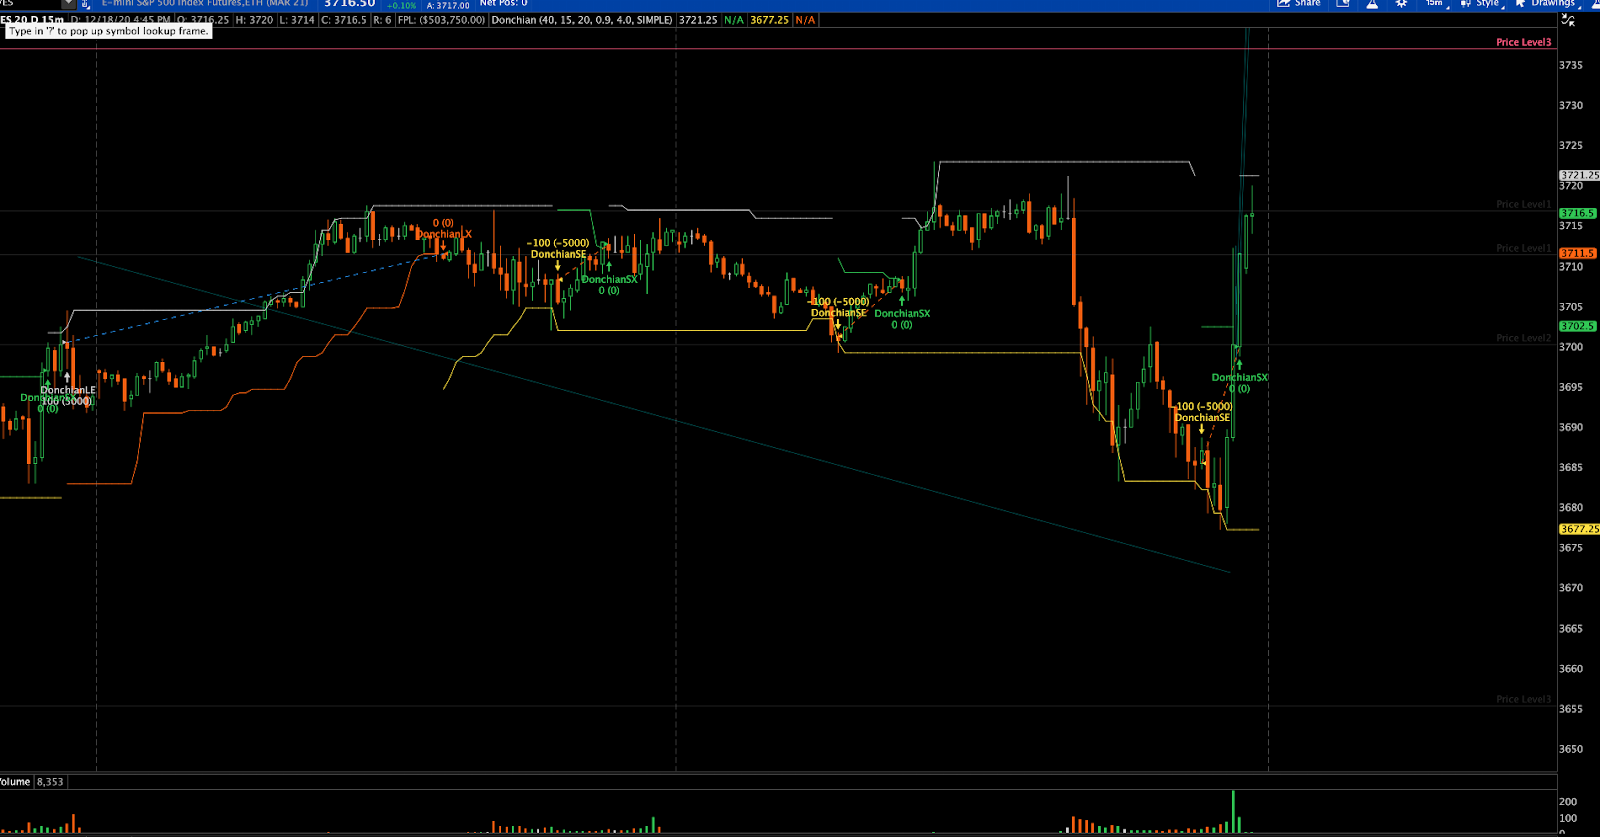
Before we dive into Keltner Channels interpretation, here is a quick task for you. Check the graph below and see if you can pick up on what it is telling you:
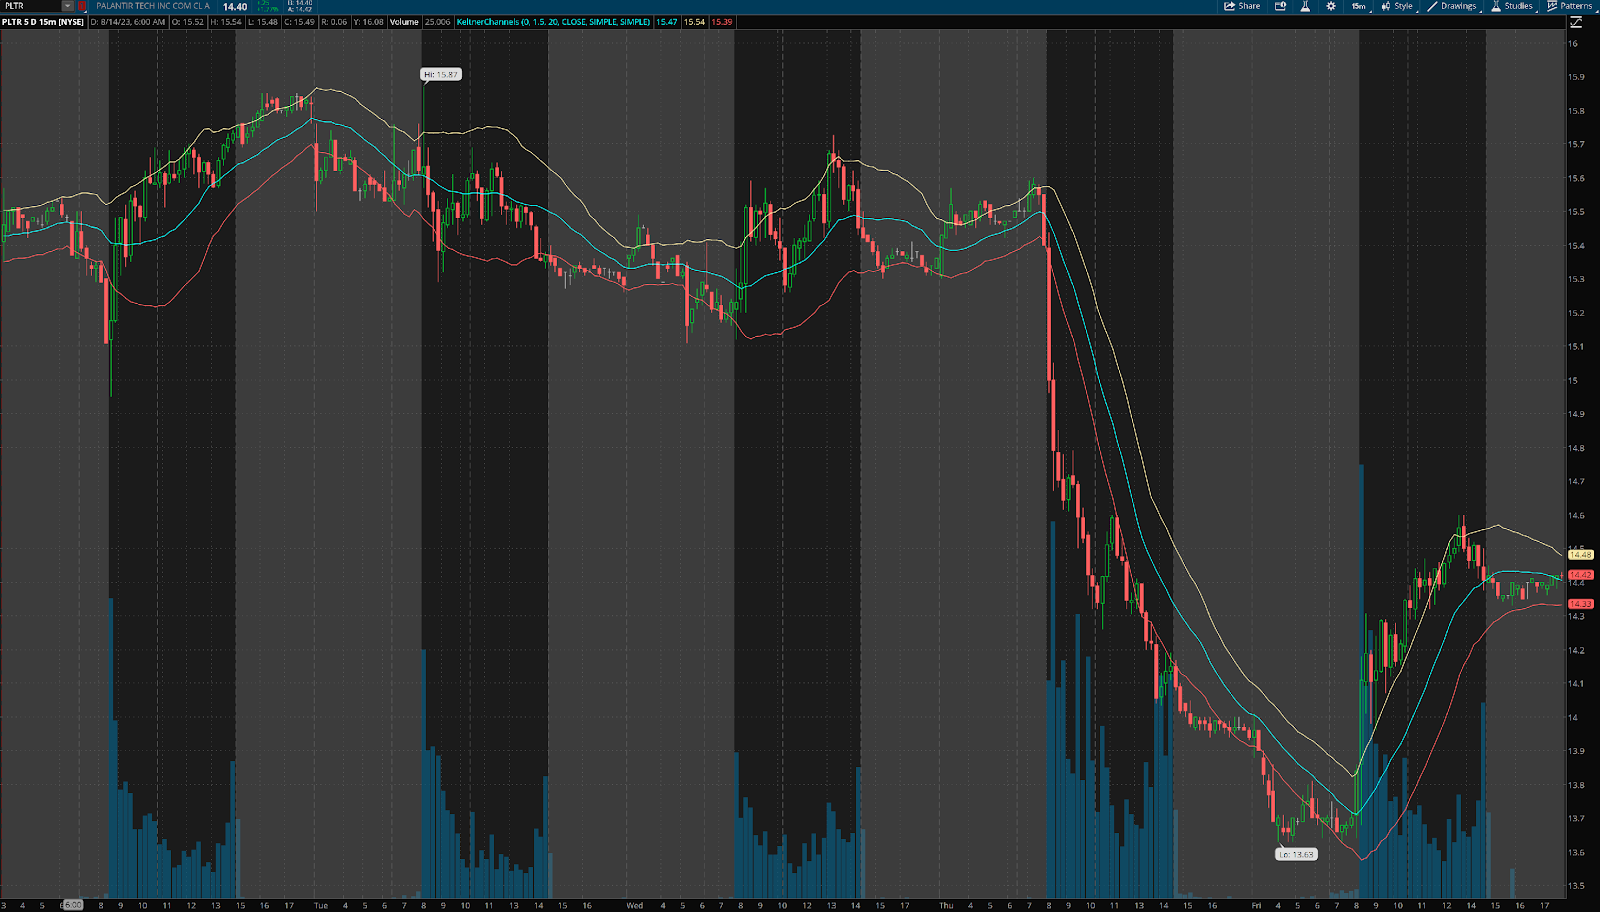
Here is a little help. Ultimately, Keltner Channel indicators offer insights into price trends and reversals by essentially creating a dynamic range around the price movement, thus capturing the asset’s volatility. When prices move beyond these channels, traders get a hint of potential strong trends or reversal points.
Swing and momentum traders often find Keltner Channels especially valuable. Since these strategies aim to exploit short and medium-term price moves, the channels can help pinpoint optimal entry and exit points.
In this article, we’ll explore:
- Constructing Keltner Channels: Detailing how the middle line and upper and lower bands are calculated, emphasizing the role of the Average True Range (ATR).
- Interpreting Keltner Channels: Exploring the meaning behind price movements related to the channels and how traders can read these signals.
- Strategies using Keltner Channels: Introducing common trading strategies that utilize the indicator for better decision-making.
- Comparative analysis: Highlighting differences and similarities with other popular indicators like Bollinger Bands.
- Limitations and best practices: Addressing potential pitfalls and best practices to help traders maximize Keltner Channels’ benefits.
Understanding the Keltner Channels Indicator
Keltner Channels are a volatility-based technical indicator frequently used in charting. Its primary function is to offer traders insights into price trends and the possibility of reversals by visually representing the volatility of a given asset.
The indicator comprises three primary components. The middle line, typically an exponential moving average (EMA) of the closing prices, is usually set to a 20-day period. The EMA serves as a central marker for the asset’s price movement trend.
The upper and lower bands are constructed by adding and subtracting a multiple of the Average True Range (ATR) from this middle line. These bands then capture the asset’s inherent volatility. When prices extend beyond these bands, it might indicate a price breakout or signal potential overbought or oversold conditions.

The Keltner Channels were created in the late 1950s by Chester W. Keltner. A commodities futures guru, he introduced the indicator in his (now out of print) 1960 book, “How to Make Money in Commodities.” Keltner first unveiled the indicator under the nomenclature “Ten-Day Moving Average Trading Rule.”
For history buffs’ interest, Keltner’s original version varied from what most traders use today. He used simple moving averages (SMA) and based his band calculations on the day’s high-low range. Of course, over time, with the growing market sophistication and technology enhancements, Keltner’s successors tweaked the formula.
Commodities and futures trader Linda Bradford Raschke played a pivotal role in the indicator’s modernization, popularizing the idea of incorporating the Average True Range in the calculations. This adaptation is more responsive to today’s market volatility.
Keltner Channels Calculation
As one of the popular indicators, your trading platform of choice likely has the Keltner Channels as a preselected option that you can tweak or adjust. Still, understanding the underlying calculations and formulas can help traders better implement Keltner Channel-based strategies.
Remember, with three lines in the Keltner Channel, we must run three separate calculations:
The middle line is the EMA and uses a weight factor defined as (2/20+1). Weight factors vary depending on trader preference, but this is the baseline standard. The EMA’s formula is: ((Current Price x Weight Factor) + (Previous EMA x (1 – Weight Factor))/2.
We calculate the upper band using the EMA, ATR, and a multiplier (usually set to two, but this varies based on preference): EMA + (ATR x Multiplier).
Likewise, the lower band deducts the latter half of the equation from the EMA: EMA – (ATR x Multiplier).

Implementing Keltner Channels in Trading
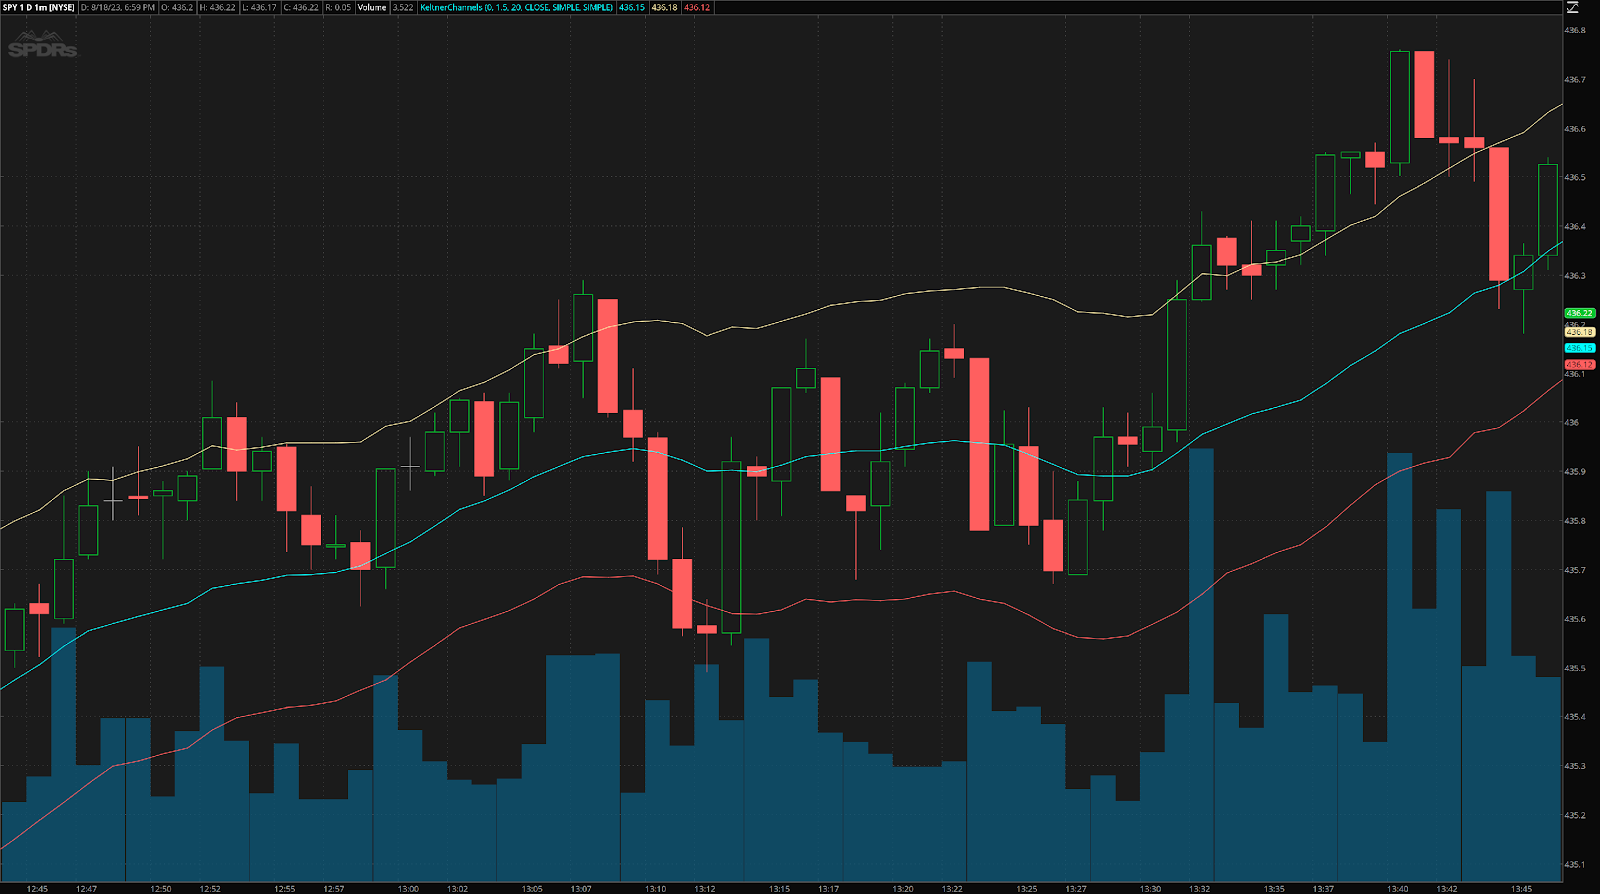
On a chart, Keltner Channels are three lines around the price bars or candlesticks. These bands expand and contract based on the underlying asset’s volatility, measured by the ATR.
Traders use Keltner Channels for identifying:
- Overbought/Oversold Conditions: When the price moves outside the upper band, the asset might be overbought, signaling a potential pullback. Conversely, if the price falls below the lower band, it might be oversold, indicating a possible price bounce.

- Trends: A sustained move above the middle EMA line can hint at an upward trend, while a persistent move below it might suggest a downward trend. Day traders use this information to align their trades with the prevailing short-term trend.
- Dynamic Support and Resistance: For day traders, the bands serve as fluid support and resistance levels. The upper band acts as a dynamic resistance, where prices might face selling pressure. The lower band acts as support, where buying interest might emerge. This dynamic nature makes them adaptable to volatile intraday movements.
Identifying Pullbacks and Trading Breakouts and Breakdowns
Keltner Channels shine in detecting potential pullbacks, primarily when prices stretch too far from the middle line or EMA.
- A pullback to the EMA: If an asset’s price is consistently above the EMA (indicative of an uptrend) and then retraces back to touch or approach the EMA, it could mark a potential buying opportunity. Similarly, in a downtrend, if the price consistently trades below the EMA and then rises to approach or touch the EMA, it might present a short-selling opportunity.

- Oversold/Overbought Pullback: If the price dives below the lower band after trading in a range or above the EMA, it’s potentially oversold and might revert to the mean. Conversely, if the price soars above the upper band, it’s possibly overbought and might pull back towards the EMA or further.
The Keltner Channels’ dynamic nature makes them especially useful for highlighting breakout and breakdown scenarios.
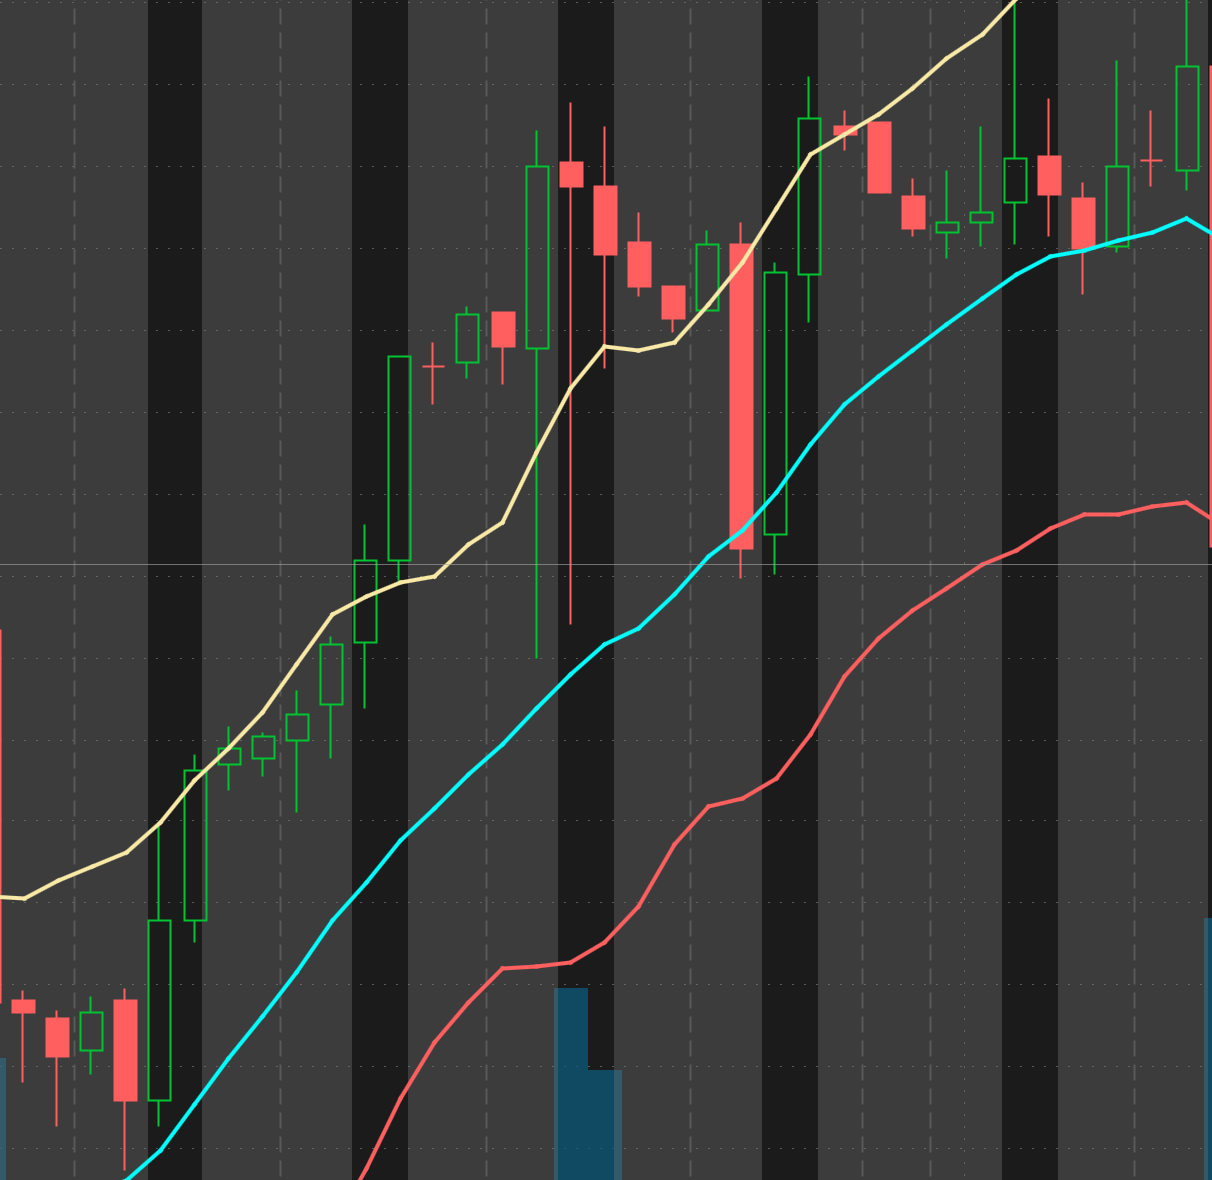
- Breakouts: When the price consistently hugs or tests the upper band and then moves even further beyond it, especially with increasing volume, it indicates a strong bullish breakout. Traders might consider entering a long position, expecting the momentum to continue.
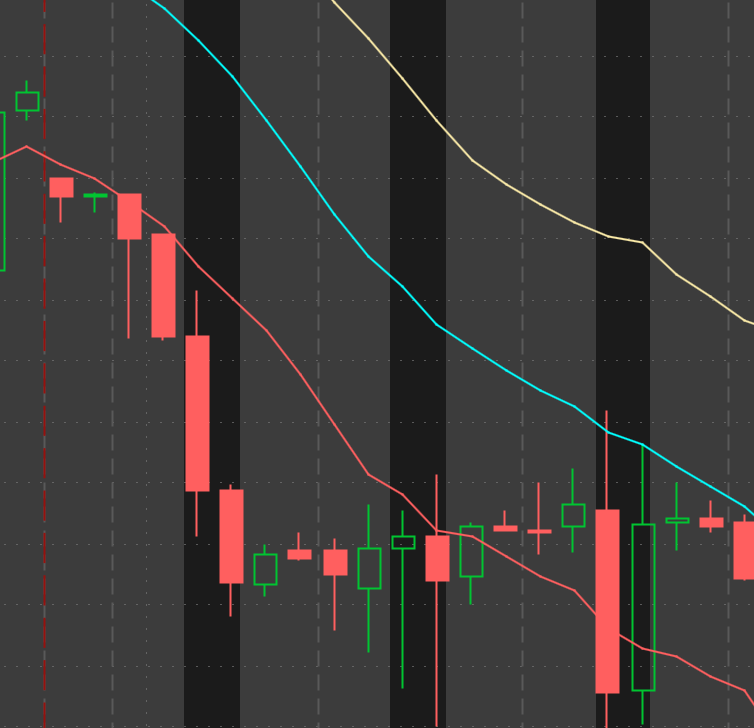
- Breakdowns: Conversely, if the price is persistently near or testing the lower band and then sharply drops below it with significant volume, it signals a potential bearish breakdown. This might be an opportunity for traders to short-sell, anticipating further declines.
For both pullbacks and breakout/breakdown scenarios, it’s (of course) important to use additional confirmation tools like volume indicators or other technical signals to double-check the strategy.
Keltner Channel vs. Bollinger Bands
Keltner Channels and Bollinger Bands are both envelope-style indicators that surround an asset’s price with a set of bands. They both aim to encapsulate most of the price action, but their construction, interpretation, and optimal use differ.
Constructing Keltner Channels and Bollinger Bands
Keltner Channels: They have three components. The middle line is an Exponential Moving Average (usually a 20-period EMA). The upper and lower bands are derived by adding and subtracting a multiple of the Average True Range (ATR) from the middle line, capturing the asset’s volatility.
Bollinger Bands: Bollinger Bands consist of a middle band being a Simple Moving Average (typically a 20-day SMA) with the upper and lower bands set as standard deviations away from this average, portraying the asset’s volatility.
Interpreting Keltner Channels and Bollinger Bands
Keltner Channels: A movement beyond the bands, especially the upper or lower channel, indicates potential overbought or oversold conditions. The width between the bands also reflects the asset’s volatility.
Bollinger Bands: The primary interpretation revolves around the “Bollinger Squeeze,” where a narrowing of the bands forecasts an impending volatility surge. Conversely, a widening of the bands indicates decreasing volatility.
Ideal Uses for Keltner Channels and Bollinger Bands
Keltner Channels: Best for identifying pullbacks within trends. When prices retreat to the EMA or move beyond the bands, there’s potential for a return to the mean.
Bollinger Bands: Highly effective for volatility breakouts. The ‘squeeze’ signals traders to brace for a surge in price movement, either upward or downward.

While both indicators offer invaluable insights, the choice between them depends on the specific strategy and preference of the trader. Whether focusing on pullbacks or anticipating volatility breakouts, understanding the nuances of each tool is pivotal.
For a more detailed dive, check out our Bollinger Band summary.
Keltner Channels vs. Donchian Channels
While both Keltner Channels and Donchian Channels are tools for gauging volatility and potential breakouts, they’re built upon different concepts and have distinct characteristics.
Constructing Keltner Channels and Donchian Channels
Keltner Channels: The framework consists of three bands. The middle one is an Exponential Moving Average (often a 20-period EMA). The upper and lower bands are set by adding and subtracting a multiple of the Average True Range (ATR) from this central EMA, encapsulating the volatility of the asset.
Donchian Channels: Donchian Channels are formed using highs and lows over a predefined period, often 20 days. The upper band is derived from the highest high of this period, while the lower band is the lowest low. The middle band is the average of these two.
Interpreting Keltner Channels and Donchian Channels
Keltner Channels: Movements beyond the upper or lower bands suggest potential overbought or oversold conditions. The distance between the bands serves as an indicator of the asset’s volatility.
Donchian Channels: These channels shine in breakout strategies. A move above the upper band signifies a bullish breakout, while a move below the lower band can indicate a bearish breakout. The middle band acts as a dynamic level of support or resistance.
Ideal Uses for Keltner Channels and Donchian Channels
Keltner Channels: These channels are adept at identifying potential pullbacks within a prevailing trend. The relationship between the price and the EMA, coupled with the bands’ width, provides cues on the asset’s possible moves.
Donchian Channels: Particularly useful for traders practicing trend-following strategies. When prices break out of the channels, it indicates potential continued momentum in the breakout direction.
In essence, both Keltner and Donchian Channels are used to gauge volatility and identify potential breakouts but their construction and emphasis differ. The choice between them hinges on a trader’s strategy and the specific market conditions they aim to capitalize on.
For a deeper exploration of Donchian Channels, we have a full breakdown here.
Keltner Channels Pros and Cons
Advantages:
- Versatility: Suitable for various trading strategies, including trend-following, mean-reversion, and breakout trading.
- Dynamic Nature: Automatically adjusts with changing market volatility, offering more sensitive readings during high-volatility periods and lesser sensitivity during low-volatility phases.
- Pullback Identification: Effective at signaling potential oversold or overbought conditions when prices move beyond the upper or lower bands.
- Trend Confirmation: The relative positioning of the price with respect to the middle EMA can help confirm the prevailing market trend.
- Clear Boundaries: Offers visually clear potential support (lower band) and resistance (upper band) levels.
Drawbacks:
- False Signals: Like many indicators, Keltner Channels can occasionally generate false breakout or pullback signals, especially in choppy markets.
- Lagging Indicator: Based on past data, there’s inherent lag, which might cause traders to miss optimal entry or exit points.
- Not Standalone: For best results, they should be used in conjunction with other indicators or tools to validate signals and reduce the potential for false alarms.
- Complex for Novices: New traders might find it challenging initially to interpret the bands and the EMA in real time.
- Limited Differentiation: In less volatile markets, the bands might not provide significantly different information than the central EMA.
Conclusion
Navigating the trading world is tough, but tools like the Keltner Channels shed light on potential market moves and help traders refine their strategies.
Keltner Channels envelop an asset’s price, adjusting dynamically to its volatility. This offers a dual advantage: clear visual cues for potential overbought or oversold scenarios and a consistent measure of the ongoing market trend based on the price’s relation to the central EMA.
Of course, every tool has its deficiencies. The potential for false signals, especially in inconsistent markets, requires combining Keltner Channels with other indicators. This synergy can create a more robust and reliable trading strategy.
The trading world is as much about strategy as it is about adaptation. With tools like Keltner Channels in one’s arsenal, a trader is better equipped to interpret market dynamics and make informed decisions – ultimately improving their performance.