
Last Updated on June 18, 2024
Trendlines are arguably the most basic charting tool. By connecting different data points, they help identify and detect trends and important price levels for trading.
There are different types of trendlines, including ascending (also known as an uptrend – indicating positive momentum), descending (or downtrend – indicating a decline), or horizontal (indicating sideways price action).
This guide walks you through everything you need to know about trendlines, including what they are, how to chart them, and how to use them to improve your trading performance.
What are Trendlines and How Do They Work?
Trendlines are lines on a chart that connect a series of data points, which could be swing highs, lows, or just generally important price points.
One of the key goals of using trendlines is to provide a visual presentation of the market’s behavior. By connecting essential data points, one can identify and project potential future movements.
Here is a step-by-step guide on how to plot a trendline on the chart and use it to try predicting future movements.
Identify the Key Price Points
Trendlines are drawn by simply selecting a starting point that’s usually a swing high/low and then connecting it to other essential price points such as other highs, lows, closes, or opens on a chart.
That’s why one should start by identifying specific data points on the chart over a certain period. These points could be prices at the close of a trading day or notable swing highs and lows.
Draw the Trendline
Seek to connect at least two data points with a straight line. The more data points a line touches, the stronger the trendline and the more consistent the trend.
Note that most experienced traders prefer to use three points as a minimum before considering drawing a trendline. However, the more, the merrier.
Confirm the Trendline
Once you draw the initial line, you can start analyzing the trend. Sometimes an initial trend line could be a “draft” version – meaning that you can proceed to modify it if it helps better understand the price action during this phase.
An upward-sloping trendline shows an uptrend, indicating that the asset in question is generally in a bullish trend. On the other hand, a downward-sloping trendline shows a downtrend. Lastly, a flat/horizontal trendline indicates that the price action could be moving sideways or that an identified horizontal trend line is acting as a significant support/resistance.
Make Predictions
The ultimate goal is to have trendlines help you project where the price action could go. However, one should proceed carefully here, given that trendlines aren’t a guarantee of future price movements.
For example, assume that you have decided to set a stop loss trigger too close to the trend line. This could often result in a trade being closed due to a price action whipsaw, even though it might still proceed to go in the desired direction.
Or, let’s say that you have identified an essential ascending trend line that supports the price action. However, this doesn’t mean a break couldn’t occur and accelerate a move to the downside, so be cautious.
Remember, trendlines are simply tools for predicting likely future trends based on historical data points. Keep in mind that many factors can lead to deviations from the direction, such as sudden market changes, anomalies, or unexpected events.

The Three Types of Trendlines
There are three generally accepted types of trendlines that are used while identifying price patterns, reversals, and continuations:
- Uptrend/Bullish Trendlines – they are drawn by connecting at least two higher lows on a chart, forming a line that is moving up. This pattern shows that demand is increasing even as the price rises, which is typically seen as a bullish signal.
- Downtrend/Bearish Trendlines – they are drawn by connecting at least two lower highs on a chart, forming a line that moves down. This formation demonstrates that supply is outpacing demand even as the price falls – usually a bearish signal.
- Horizontal Trendlines – also known as support and resistance lines, they are drawn by connecting multiple points at the same or nearly the same level. Support lines represent levels where the price has historically had difficulty falling below, indicating strong demand at/around this level. Resistance lines show levels where the price has historically struggled to rise above, indicating strong supply.
Why are Trendlines Important in Trading?
Trendlines can help spot trends (bullish, bearish, or sideways), detect support and resistance levels, as well as help define the optimal levels for risk management controls (e.g., stop losses or take profits). A lot of traders also use trendlines to detect entry and exit points.
Trendlines is one of the most popular charting tools by analysts and traders. Arguably the most important aspect of the indicator is its simplicity. A chart would usually have several trendlines that define the “battlefield.”
Trendlines are easy to build and identify on the chart as it only takes two data points to draw a line. As such, they can help traders, especially those with little or no experience, to identify the direction in which the price is heading.
Despite their crucial importance and increased popularity, trendlines shouldn’t be used as a stand-alone indicator or strategy to make trades. Instead, traders should combine trendlines with other technical indicators (moving averages, Fibonacci retracement/extension levels, volume-measuring tools, etc.).
How to Use Trendlines in Trading
Now that you know how to identify trendlines, it is time to learn how to use them in trading. Once the trendline is confirmed (price action touched it several times and reacted off it), we proceed towards identifying the trend direction, as well as the support and resistance levels.
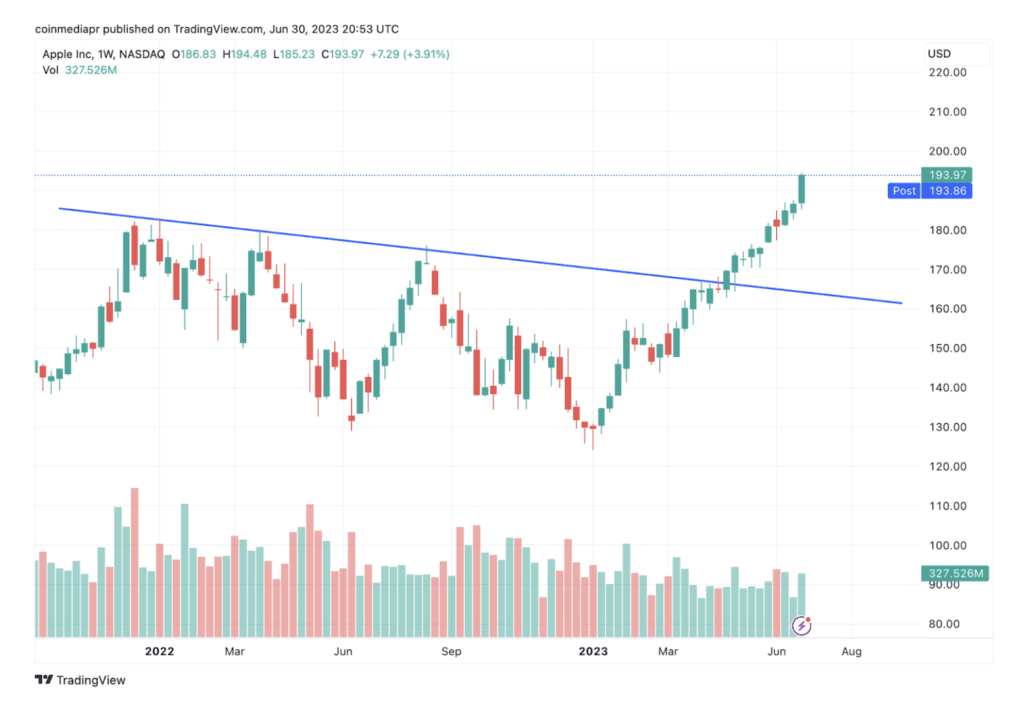
In the AAPL chart below, you can see three connected swing highs form a descending trend line that acts as a strong resistance. After several attempts to break this trend line, Apple bulls finally succeeded, which led to the price surging higher.
In this case, the trend line can be used to:
- See where the resistance is given that the price action is in an uptrend;
- Identify a support level IF the price action breaks higher (the resistance would become support);
- Identify a breakout level if bulls manage to crush resistance and extend the uptrend.
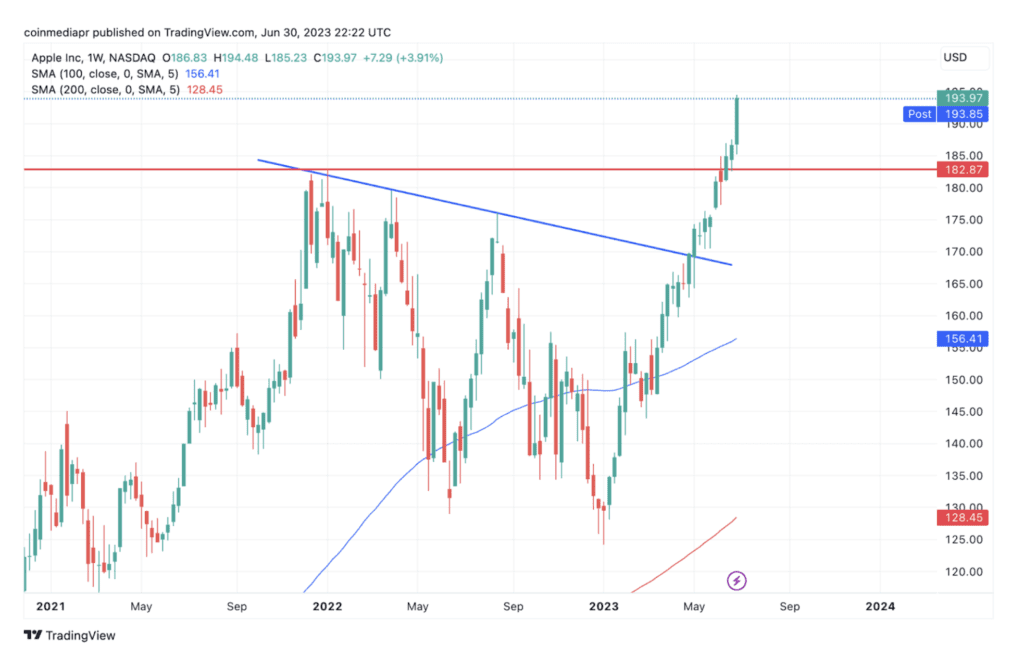
We can also add a new trend line (the red horizontal line) that shows the former record high (the highest of the three tops). Despite not connecting at least two data points, in this case, the drop to lower levels would likely stall at this support due to its importance (a former record high).
Trendline Confluence, Bounce, and Breakout
Trendline confluence occurs when multiple trendlines, often drawn from different time frames (like daily, weekly, or monthly charts), converge or intersect at the same point or area on a chart. If two or more trendlines cross in the same area, there is a “confluence” of support/resistance levels that is likely to act as a magnet for the price action.
In general, a confluence zone can act as a more reliable level of support or resistance, given that multiple trendlines meet there to highlight the importance of the price level.
A trendline bounce refers to a situation where the price bounces off a trendline and continues toward the current trend. There is a difference between a bullish and a bearish bounce. The former occurs when the market is in an uptrend, and the price bounces off the upward-sloping trendline, which could be considered a buy signal. The latter happens when the market’s in a downtrend and the price bounces off the downward-sloping trendline, this could be viewed as a sell signal.
A trendline breakout takes place when the price breaks a trendline, potentially signaling a change in market sentiment and the start of a new trend. A bullish breakout occurs when the price breaks the trendline and closes above it, while a bearish breakout assumes the opposite scenario.
Trendlines Trading Strategies
The two most often used trendline strategies are based on breakouts and bounces. As explained above, the breakout trading strategy occurs once the price action moves above/below the trendline.
In this case, the trader sets a buy/sell stop order that is triggered when the price action is approximately ten or so pips above/below the trend line. The breakout is confirmed once the price action secures a daily close above/below the trend line.
On the other hand, a bounce trading strategy is based on betting against the trend. While the ascending trendline supports the uptrend, a break below it signals its potential end.
Instead of waiting for a breakout, the trader uses the trendline as support and waits for a bounce to take place and the ultimate continuation of the bullish trend. The stop loss order is placed ten or more pips below the trendline. The bounce trading strategy makes sense if the identified trendline has a history of acting as strong resistance/support.
It’s important not to use trendlines as the sole basis of your trading strategy. Make sure to complement it with other tools, including volume-measuring indicators, moving averages, Fibonacci levels, and more.
It’s crucial to use stop-loss orders to limit potential losses if the trade doesn’t go as planned.
Last but not least, note that trendlines can also help determine where to take profits. For example, if long on Apple shares and the incoming trendline is acting as a strong resistance, it would make sense to set a take profit order near the trendline as the price action may reverse and erase a portion or all of the gains.
Summary
Trendlines represent lines drawn over important data points, usually swing highs and lows. They are a simple technical tool widely used to identify trends and resistance/support levels.
Trendlines could be ascending, descending, or horizontal. They are best used in conjunction with other technical tools and can be beneficial in projecting future price movements. However, avoid using them as the sole basis for your trading strategy.