
The stochastic oscillator is one of those indicators you might notice on a wide array of investment charts. It looks instrumental, but what exactly does it do? A stochastic oscillator chart is a popular way to measure momentum. However, what conclusions can you draw from the indicator’s formula, and how can you use it?
What is the Stochastic Oscillator?
A stochastic oscillator chart allows you to identify momentum in the price of a financial asset. At the core of this indicator is the stochastic oscillator formula. It compares the closing price of a security to the recent high and low prices. You then convert it into a figure between 0 and 100 which is the actual stochastic oscillator value. This is where it starts to get interesting!
Let’s say you speak to two traders independently and ask them what the stochastic oscillator shows. There is a good chance you will get two vastly different answers. On the one hand, the stochastic oscillator is an indicator of momentum both upwards and downwards. On the other hand, some traders may see it as an indicator of overbought and oversold prices. Both explanations are correct in theory. The critical difference is how you use the indicator within your investment strategy.
There are other factors to take into consideration. One of them is the period over which you take the low price and the high price. You will need to research the ideal indicator settings for your own particular trading method. Are you happy to go with a longer-term, flatter trend? Alternatively, would you prefer a more sensitive short-term indicator that might alert you to short-term trading opportunities?

You might also enjoy:
- Candlestick Patterns – Complete Guide to Bearish and Bullish Candlesticks
- What are Fibonacci Retracements and How to use Them?
A Brief History
There is some debate as to the origins of the stochastic oscillator. Especially the %D indicators we will cover later in the article. Many believe that C. Ralph Dystant was the original creator of the indicator. However, George C. Lane is perhaps more commonly credited for his role in popularizing it. The latter also introduced several tweaks and adjustments.
We can trace the stochastic oscillator back to the 1950s when C. Ralph Dystant taught stock-market courses. In these courses, his original focus was on commodities. The classes were one of the first to focus on charting, moving averages, and other indicators to predict future price movements. Incidentally, George C. Lane supposedly started working for C Ralph Dystant in 1954. That was the same year as the retirement of technical “guru” Roy Larson. Was it a coincidence?
It would be fair to say that both C. Ralph Dystant and George C. Lane were integral to creating the stochastic oscillator indicator and the influence it still holds with investors today. In many ways, the key to its success is its relative simplicity. The masterstroke was introducing an easy-to-understand range between zero and 100. In the words of Kelly Johnson, former lead engineer at Lockheed Skunk Works, “keep it simple, stupid.” Many traders today refer to this quote as the KISS principle.

How Does the Stochastic Oscillator Work?
Now let us examine how the stochastic oscillator works. We will also take a look at how quickly you can adjust the sensitivity of the indicator. The basic concept behind the stochastic oscillator is momentum. It gives you the ability to monitor the momentum of an asset’s price. Doing so lets you see whether it is potentially oversold or overbought compared to recent highs and lows. However, therein lies a potential conundrum.
A Simple Example
What if we look at the S&P 500? The E-Mini S&P 500 futures contract is amongst the highest volume assets in the futures market. What will looking at its momentum show us? Picture the example of firing a rocket into the sky. It will not just suddenly stop and turn back to earth right away after running out of fuel. The fading momentum will continue to push it higher at a drastically falling speed. However, when the positive momentum eventually ends, the rocket will turn and head back towards earth. As a result, it builds up new momentum along the way. This is the idea behind the stochastic oscillator. Using the recent highs and lows for comparison, you should be able to identify a change in momentum. That result should be reflected in the charts as well.
There is a general consensus that when stochastic oscillator levels fall below 20, it indicates the asset is oversold. Meanwhile, if it moves above 80, that indicates the asset is overbought. Let us take 50 as our mid-value. In theory, the positive momentum is above the line, while the negative momentum is below it. Although this is generally the case, stay aware of possible false signals. Now let us move on and look at how to read and understand the stochastic oscillator indicator.
Stochastic Oscillator Formula and Calculation
In this section, we will take a look at the stochastic oscillator formula. We will also point out what elements of the formula you can adjust to change the sensitivity. The basic formula is as follows:
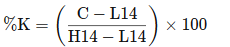
C = the most recent closing price
L14 = the lowest price traded over the last 14 trading sessions
H14 = the highest price traded over the last 14 trading sessions
%K = the current value of the stochastic indicator as a percentage
To give a practical example of how the indicator works, we will look at the S&P 500 index. This is the figure the E-mini S&P 500 futures contracts are based on.
Current level = 3490
Low point last 14 trading sessions = 3300
High point last 14 trading sessions = 3500
So the calculation is as follows:
3490-3300/3500-3300 = 190/200
(190/200) x 100 = 95%
Example
So, according to the stochastic oscillator indicator, the S&P 500 index has strong momentum and is potentially in “overbought” territory. Many people would class this as the standard stochastic oscillator indicator calculation based upon 14 trading sessions. However, how does the situation look if we base it on eight trading sessions?
Current level = 3490
Low point last 8 trading sessions = 3400
High point last 8 trading sessions = 3500
3490-3400/3500-3400 = 90/100
(90/100) x 100 = 90%
Finally, what indication does the calculation give us with a 30 period moving average:
Current level = 3490
Low point last 30 trading sessions = 3200
High point last 30 trading sessions = 3500
3490-3200/3500-3200 = 290/300
(290/300) x 100 = 97%
The shorter the period in question, the more sensitive the formula will be to daily movements. The reason is that the difference between the high and the low point should be relatively small, in theory. The S&P 500 index has strong momentum over 14 days and 30 days in the above three examples. However, it is notably lower if you only look at it for 8 days. However, they all indicate a potentially overbought scenario.
Other Important Formulas
You will also come across what traders refer to as the %D stochastic oscillator indicator. This is traditionally a three-day average of the %K indicator. The %D removes many of the short-term fluctuations in the %K base chart. That gives it smoother trend lines which are often easier to read. The downside of the %D is that emerging trends will show up later than in the %K. That is because it is a rolling average.
Then you have the slow stochastic oscillator indicator. The %D figure is traditionally a three-day rolling average over the %K three-day rolling average with the slow stochastic oscillator. We calculate the slow indicator, as well as the average indicator from the primary indicator. The latter is also sometimes referred to as the fast stochastic indicator. This creates an even smoother chart where movements above 80 and below 20 can be rare. However, we can consider them strong signals when they do occur.
How to Read Stochastic Oscillator Charts
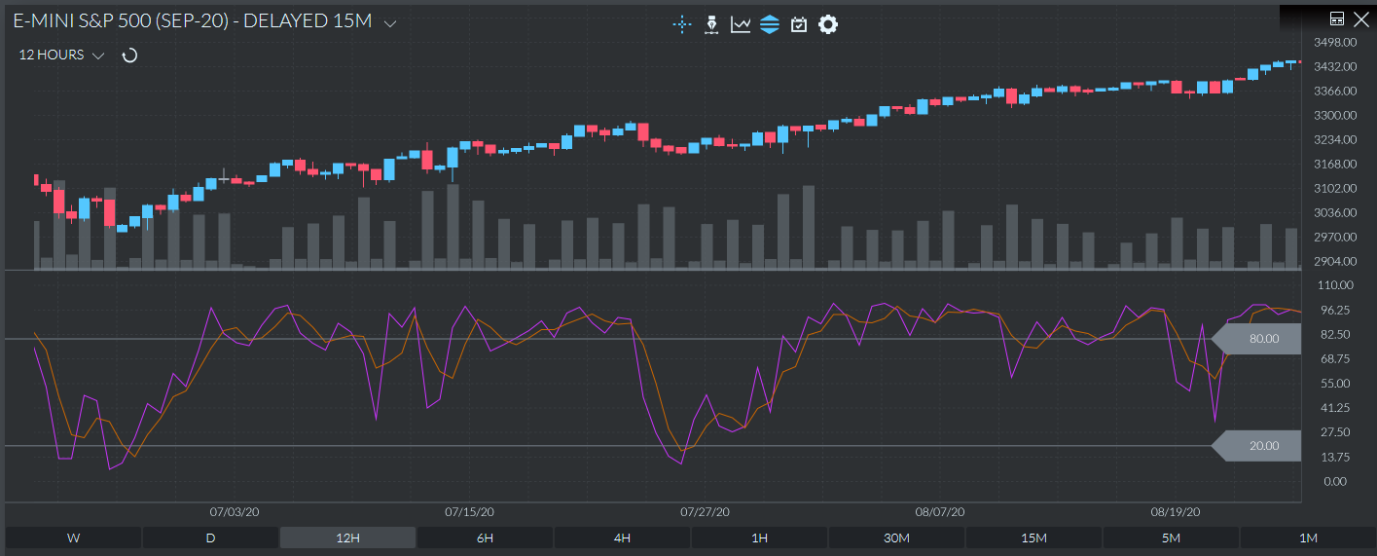
Next, let us take a look at two stochastic oscillator indicator charts. We will highlight some of the turning points which could have proved beneficial for traders. The first chart is the traditional (fast) stochastic oscillator indicator with a smoother %D trend line based upon the %K factor.
The second chart is what we refer to as a “slow stochastic oscillator indicator.” It averages out the index level over a more extended period. Then we have the %D factor based upon the %K and gives an even smoother line. The longer you extend the period over which you examine the prices, including highs, lows, and current prices, the smoother the chart. However, there will be a significant lag. On the upside, in many ways, this can help to offset short-term peaks and bottoms that can sometimes tempt people into buying and selling when they should not.

Towards the start of this chart (after the initial fall), you will notice that the purple line, the short-term %K line, moves up through the %D line (orange line) around the 20% level. Many people believe this represents a strong buy signal.
Placing the Example on a Timeline
As it happens, this was the start of a rally in the index. The rally lasted until around the 24th of July. After the initial rally from oversold (strong momentum) to overbought (weakening momentum), the stochastic oscillator indicator fluctuated just around the 80% line. A general consensus is that anything above 80 is potentially overbought, and anything below 20 is potentially oversold.
Interestingly, the short-term dip in the index from the 24th July to 27th July saw the indicator move from an overbought to an oversold position. When the %K line moved through the %D line on 27 July, it indicated another rally. That rally continued until 19 August. Then a short-term consolidation saw the trend lines dip under the critical 80% figure. That looked like a classic pullback after a strong rally. Not long after, the chart indicated another rally may be imminent. It was at the point when the trend lines crossed again, on the way up.
How to Use the Stochastic Oscillator
The key to using the stochastic oscillator is finding the timespan that best suits your investment strategy. Those looking for short-term trades will focus on relatively short periods, prompting somewhat volatile swings in the indicator. Those looking for the confirmation of longer-term trends will extend the period in question. These charts will be smoother, and due to the extended lag, they are not as susceptible to short-term swings.
What Are the Best and Most Accurate Settings?
There are three variables to consider when looking at stochastic oscillator settings which are:
%K = based upon the number of time periods used in the calculation
Slowing = simple moving average (SMA) factor applied to %K
%D = %K moving average factor
As we mentioned above, the stochastic oscillator has three different types. These are:
The fast stochastic oscillator (traditional indicator)
Fast %K = basic calculation of %K over 14 periods
Fast %D = three period SMA of %K fast stochastic oscillator
The slow stochastic oscillator
Slow %K = fast %K expressed as a three period SMA
Slow %D = three period SMA of slow %K
The full stochastic oscillator
Full %K = Fast %K smoothed over a X period SMA
Full %D = X period SMA of full %K
The beauty of this system is that all of the above variations of the original indicator produce figures from 0 to 100. As a consequence, it is easy to compare and contrast the variation in trend lines. The greater the periods over which you calculate the simple moving average, the smoother the line.
As we touched on above, the simple, fast stochastic oscillator will throw up many potentially overbought and oversold positions. Some of them will inevitably be false signals. As you can see in the charts above, the fast stochastic oscillator can be fairly volatile, often trading above or below the 80 and 20 levels for a short period of time. On the same chart, you can see areas where the %D (SMA figure) is not as volatile and does not always dip below or move above the 80 or 20 levels like the fast stochastic oscillator does.
Stochastic Oscillator Trading Strategies
There are many ways in which you can use the stochastic oscillator indicator to open positions, close positions, or even reduce your position if the chart is at a critical point.
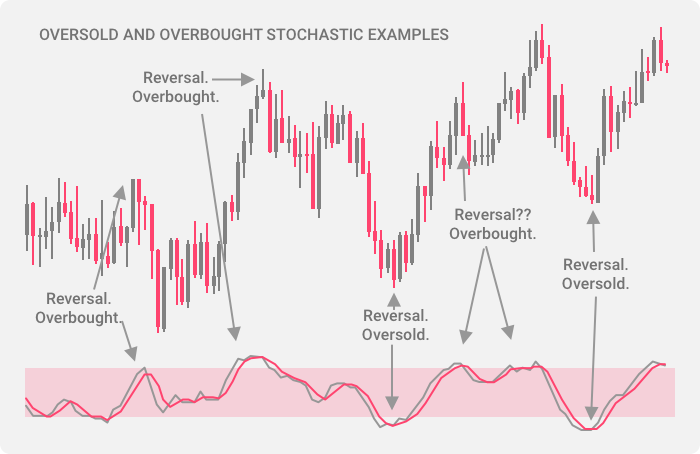
Identifying overbought/oversold indicators
As you’ll see from the chart below, various handy indicators could have resulted in some significant profits. The first overbought indicator shows the fast stochastic oscillator figure reaching the 80% level and then sharply turning downwards through the three-period SMA. Many traders see these crossover points as strong indicators that momentum is changing, and the short-term trend may be about to reverse.
The second overbought position begins to emerge when the fast stochastic oscillator and the SMA move above 80%. A move above 80% or below 20% should not necessarily be seen as a signal to sell or buy but an early warning that momentum may be about to change. Many people prefer to wait for a sustained fall back below 80% or move above 20% before reacting – thereby cutting out a degree of volatility which can sometimes create false signals. This is where the SMA lines can be instrumental, smoother, and less volatile, although you won’t necessarily sell at the top because of the lag.
You can also see the two false overbought signals where the fast stochastic oscillator figure and the SMA dipped below 80. However, they reversed quite quickly as momentum picked up again and the chart moved back into higher territory. You will find that where there is a strong uptrend, which hasn’t been broken, at some point, there will be a pullback which can be an opportunity to buy on weakness. This is why the fast stochastic oscillator is more appropriate for short-term/day traders.
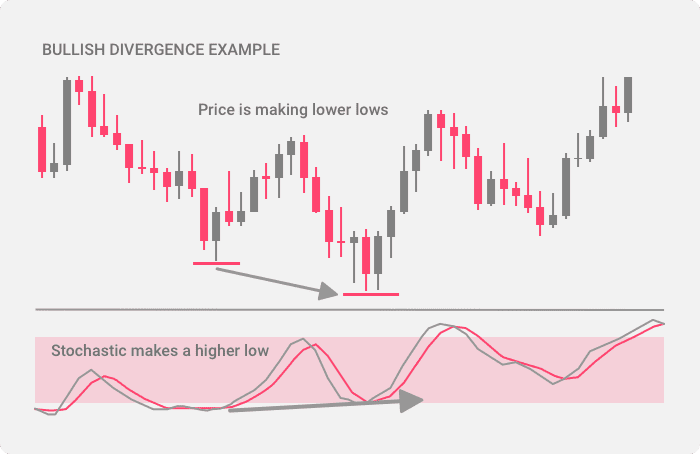
Bullish/bearish divergence
There will be occasions where there is a bullish/bearish divergence between the actual chart and the stochastic oscillator indicator. As you can see from the chart below, the low point of the chart would indicate the potential for further downside. However, when you look at the stochastic oscillator indicator, the trend moves in a different direction and is slightly bullish. This may well indicate the stock has bottomed out, and the momentum may be about to turn. One of the main signals to look at with this particular chart is the fast stochastic oscillator moving through the SMA line.
You’re just as likely to see a reversal where the main chart indicates an intact uptrend while the stochastic oscillator shows a slowing of momentum and a swing towards a downward trend. These are rarer trading signals, but they are fascinating, especially when you incorporate simple trend lines into the price charts.
Price trend indicator
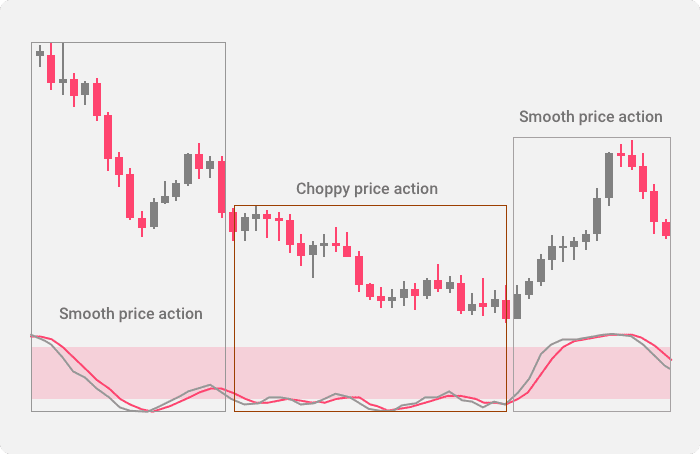
The relationship between the fast stochastic oscillator and the SMA is significant. As you can see from the chart below, the first section is dominated by the strong downtrend with the fast stochastic oscillator and the SMA running downwards in parallel. Then there is a bounce in the chart followed by a move into more choppy waters with an obvious downtrend. As you will see, the indicators remain under the 20% level indicating that momentum is relatively weak. That is until the fast stochastic oscillator breaks through the SMA line towards the end of the choppy price action area.
This change in momentum is demonstrated by the uptrend, although it is not difficult to see where the momentum is starting to fade above 80%. When the short-term trend line breaks through the SMA and falls under the 80% level, this indicates yet another change in trend – a potential sell signal.
Advantages of Using the Stochastic Oscillator
Momentum is significant when it comes to trading, and there is no doubt that the stochastic oscillator indicator is a handy tool. There are several advantages to consider which include:
Sensitive to changing momentum
The shorter the period over which the high, low, and current prices are compared, the more volatile the stochastic oscillator indicator. SMA trend lines can also create powerful buy/sell signals when the lines crossover – especially above 80% and below 20%. This event would indicate that the short-term trend is changing and, assuming it continues, a new trend will follow.
Opportunity to identify bullish/bearish divergence
Due to the way that the stochastic oscillator indicator is calculated, you will, on occasion, see a divergence between the price chart and the indicator. While the price chart may indicate that a downtrend is still intact, the stochastic oscillator chart may already identify a change in momentum before the price changes. As you will see from the chart above, these can be powerful trading signals. How long you might wait to see if a new trend does emerge will vary between traders. How brave are you?
The formula is flexible
The shorter the period in question, the more volatile the stochastic oscillator indicator. Although there is the possibility of identifying short-term trading opportunities. However, you can extend the number of periods in question for those who have a longer-term investment strategy. This will flatten the volatile, fast stochastic oscillator line and give a smoother line, potentially making it easier to identify any change in long-term trends.
Risks and Limitations of the Indicator
As with anything technical indicators, the stochastic oscillator is not immune from false signals and is probably best used in tandem with other trading indicators. Some of the risks and limitations include:
False signals
The shorter the period over which the fast stochastic oscillator is calculated, the more susceptible to extreme volatility. This can create numerous false signals, although the impact can be reduced by adding a simple moving average line.
Sideways trading
The indicator works best when there is either an emerging new uptrend, downtrend, or a short sharp period of consolidation before the trend re-emerges. During periods of sideways trading, this can create a relatively small gap between the high and low points, creating sharp movements in the indicator on relatively small price movements.
SMA lines lag trend changes
More extended periods to calculate the %K and SMA trend lines can make it easier to identify changes in the trend. However, you may miss a significant element of a changing trend due to the lag before you decide to buy or sell. You can adjust the full stochastic oscillator indicator variables to assist with your specific investment strategy, lengthening or shortening the periods, and adjusting the SMA.
Stochastic Oscillator vs Other Indicators
The stochastic oscillator indicator is extremely flexible, and you can adjust the periods and SMA variables to suit your investment plan. However, especially when looking at limited periods, there will be occasions where the indicator will create a false signal. Therefore, it is sensible to consider other means of technical analysis to clarify whether a potential change in momentum indicated by the stochastic oscillator is also reflected elsewhere.
Stochastic Oscillator vs RSI
While you can use both the stochastic oscillator and RSI (Relative Strength Index) to measure price momentum, they work on very different principles. The RSI measures potentially overbought/oversold positions by comparing recent gains to recent losses. The idea behind the stochastic oscillator is based on the assumption that the current price should follow the current trend. When the current price moves against the trend, it can indicate a change in momentum and a potential buy/sell signal. So who wins the fight, the Stochastic Oscillator or the RSI?
If the two oscillators were to indicate the same trend, this would be a powerful signal for investors. For example, if the price of an asset price was moving towards the top end of its recent high/low range, it would indicate positive momentum. Assuming that the RSI oscillator also shows a relatively strong trend, this would reduce the chances of a false signal.
Stochastic Oscillator vs MACD
The Moving Average Convergence Divergence (MACD) is a prominent momentum indicator, although it is very different from the stochastic oscillator indicator. You calculate the MACD by subtracting the 26-period exponential moving average from the 12-period exponential moving average. Many traders use the MACD technical indicator and the stochastic oscillator, often looking for crossover points between the two.
Those considering technical indicators from a distance might ask why traders don’t simply use three, four, five, or more technical indicators in tandem. The answer is simple; the time lag between different technical indicators can confuse the situation. By the time several different indicators have “line up,” you might end up missing the vast majority of the trend. There is nothing wrong with using just one technical indicator, but there are risks and false signals that can occur. Two is a company, three is a crowd?
F.A.Q
There is a general misunderstanding among some traders that the stochastic indicator creates buy and sell signals. It doesn’t. The indicator monitors momentum, which will strengthen and weaken, often suggesting a changing trend. One of the more common ways to use the stochastic indicator is to be more vigilant if it is below 20 or above 80.
For example, if the indicator was trading above 80 for some time then dipped below 80, this could indicate a significant change in momentum. Using the fast or slow %K and the %D moving average, a cross between the two gives an added degree of confidence that the momentum/trend is changing. It can also eliminate those pesky false signals!
It is not necessarily a case of whether the RSI of the stochastic indicator is “better,” but rather which one is more appropriate for your investment strategy. The stochastic oscillator assumes that an asset price will track the recent high/low depending upon the direction of the trend. The RSI takes into account recent gains and recent losses to calculate a relative strength figure. In reality, the two can complement each other and are often used in tandem by traders.
The history of the stochastic oscillator can be traced back to the 1950s, which saw C. Ralph Dystant credited with creating the basic formula. However, George C. Lane was certainly more active in promoting the indicator, introducing the concept of moving averages to complement the baseline calculations. It is no coincidence that the two worked together at C. Ralph Dystant’s stock-market education business. Whether or not you believe that technical indicators create “self-fulfilling prophecies” or not, there is no doubt that the stochastic oscillator indicator is as relevant (if not more) today as it was back in the 1950s.