As the financial market ebbs and flows, understanding how to trade breakouts and breakdowns can help you capitalize on significant price moves and potentially secure substantial profits. These strategies center around identifying key support and resistance levels which hinder price movement.
This guide delves into the intricacies of trading breakouts and breakdowns, covering everything from basic concepts to actionable strategies, as well as highlighting common mistakes to avoid.
Understanding Breakouts and Breakdowns
Breakouts and breakdowns are cornerstone concepts in trading. They guide you in pinpointing potential entry or exit points. At their core, they help highlight abrupt price momentum shifts, allowing you to leverage significant price movements.
A breakout occurs when the price of an asset “breaks out” of its previous trading range, surpassing a defined resistance level.
Conversely, a breakdown transpires when the asset’s price drops below a crucial support level, causing the price to “break down” from its previous range and trend downward.
Understanding the intricacies of trading breakouts and breakdowns can mean distinguishing between successful trades and missed opportunities.
Breakouts are a bullish sign, indicating that the price may continue to rise. This signals a potential opportunity for traders to enter a long (buy) position to capitalize on the upward momentum.
Conversely, a confirmed breakdown indicates strong selling interest, suggesting the price might continue downward. This is a bearish sign, providing a cue for traders to enter a short position or exit a long one in anticipation of further declines.
Trading breakouts and breakdowns isn’t just about predicting price movements—it’s about seizing opportunities. By identifying these crucial points on price charts, you can make well-timed entries and exits, maximizing your profit potential.

Finding Breakouts and Breakdowns
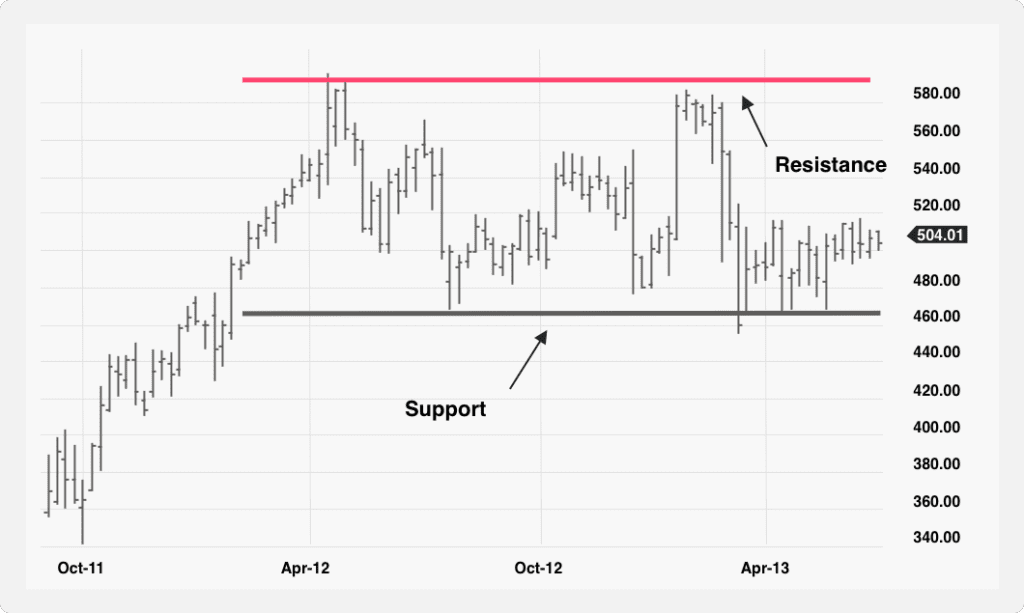
The secret to pinpointing potential breakouts and breakdowns is comprehending support and resistance levels, which are pivotal markers on price charts.
Support and resistance levels are crucial because they offer traders a glimpse of a specific asset’s prevailing supply and demand.
On trading charts:
- Support levels are where an asset typically encounters buying interest, preventing the price from descending below a particular level over a specified period.
- Resistance levels, conversely, are where selling interest is high, halting any further price ascent and possibly leading to a reversal.
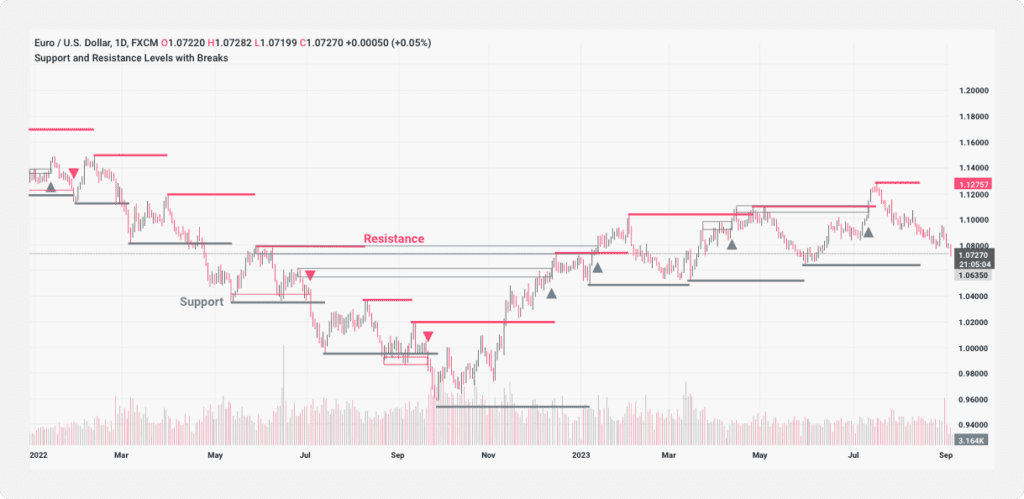
It’s essential to note that this is a dynamic process, and support and resistance levels can morph into each other. For example, when the price surpasses the resistance, it might become the new support level. Similarly, if the price plunges through a support level, it might become the new resistance.
These levels are crucial because they signify psychological market thresholds. They are zones where traders exhibit increased interest in purchasing or offloading an asset. A breakout or breakdown from these levels typically indicates a robust move propelled by amplified trader sentiment.
Identifying Support and Resistance Levels
The prevalent method to identify support and resistance levels is by examining historical price charts. The support and resistance levels appear as the points prices have consistently ascended or descended to but haven’t surpassed.
However, it’s advisable to employ technical trading indicators for real-time precision. Some of the best for the purpose include:
Moving Averages
These help in refining price data to produce a singular fluid line, facilitating the identification of trend directions. A breakout or breakdown might be signaled when the price crosses its moving average.
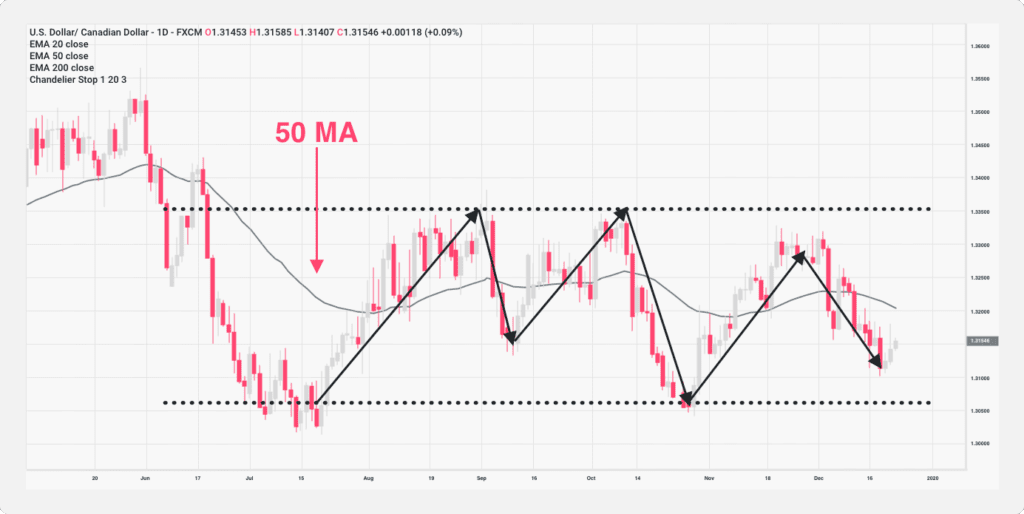
MAs provide insights into price trends by averaging historical data. This makes them invaluable for pinpointing breakouts and breakdowns. The method is straightforward for confirming specific trends. For instance, when Bitcoin exceeded its 50-day MA in December 2017, it validated the bullish momentum, culminating in its peak near $20,000.
Bollinger Bands
Bollinger Bands comprise three components:
- A middle band, which is a simple moving average
- Two outer bands, set at standard deviations from the middle band
When prices approach the outer bands, a breakout or breakdown could be on the horizon.
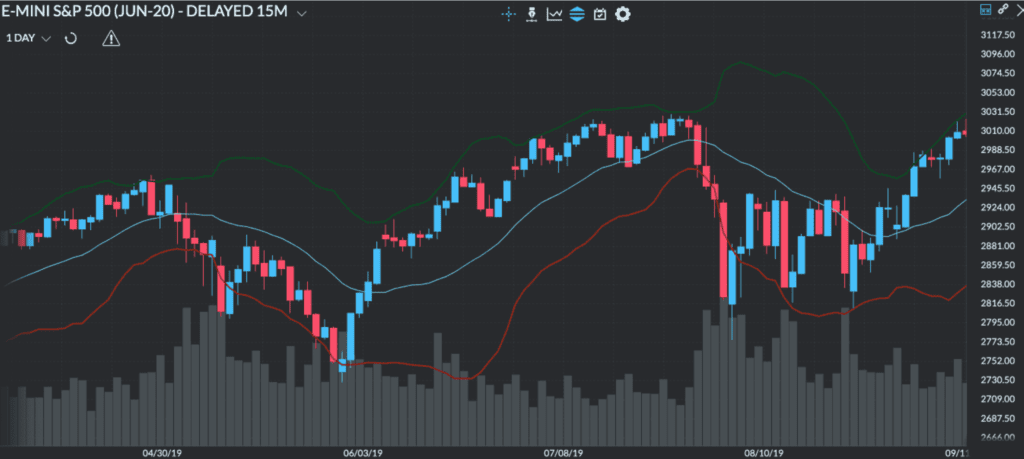
Bollinger Bands are explicitly crafted to assess volatility and potential price movements. Their distinctive features render them particularly adept for trading breakouts and breakdowns. For instance, when it comes to gauging volatility:
- Narrow bands mark periods of low volatility, hinting that the market is consolidating and a breakout or breakdown may be imminent.
- Conversely, broad bands indicate increased volatility, suggesting the market might trend strongly in a specific direction.
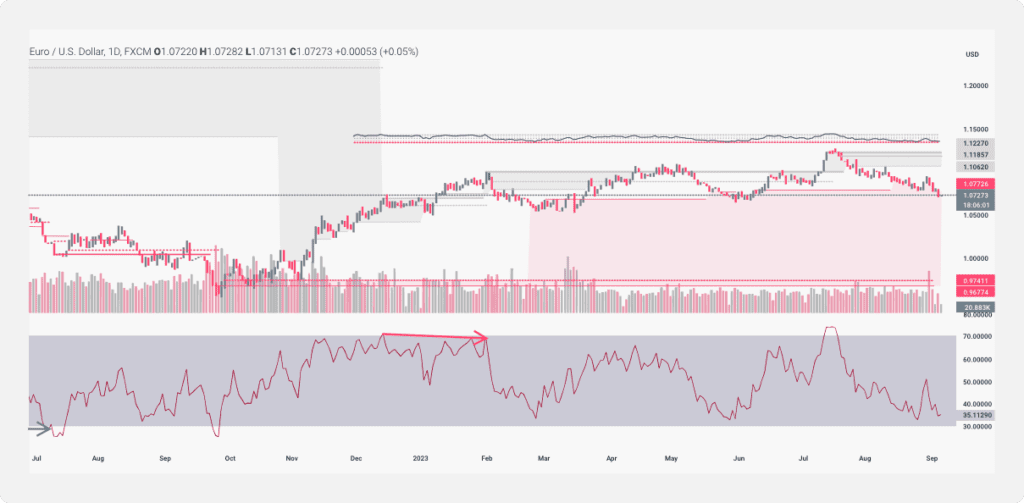
Relative Strength Index (RSI)
RSI evaluates the magnitude of recent price shifts to determine whether assets are overbought or oversold. This makes it a very useful indicator for trading breakouts and breakdowns, as it’s adept at highlighting potential price reversals.
An RSI reading above 70 can suggest an overbought condition, implying a potential breakdown below the designated support level as traders consider closing their positions. Conversely, an RSI below 30 indicates the asset is undersold, suggesting the price might break above the resistance level as traders initiate long positions.
In reality, the RSI methodology is slightly more intricate than described here. That’s why, for a comprehensive understanding, we advise you to read our dedicated article: Relative Strength Index (RSI) – What is it and how to calculate it?
Moving Average Convergence Divergence (MACD)
MACD, a momentum oscillator, plays a crucial role in detecting shifts in market momentum, making it essential for spotting potential breakouts and breakdowns.
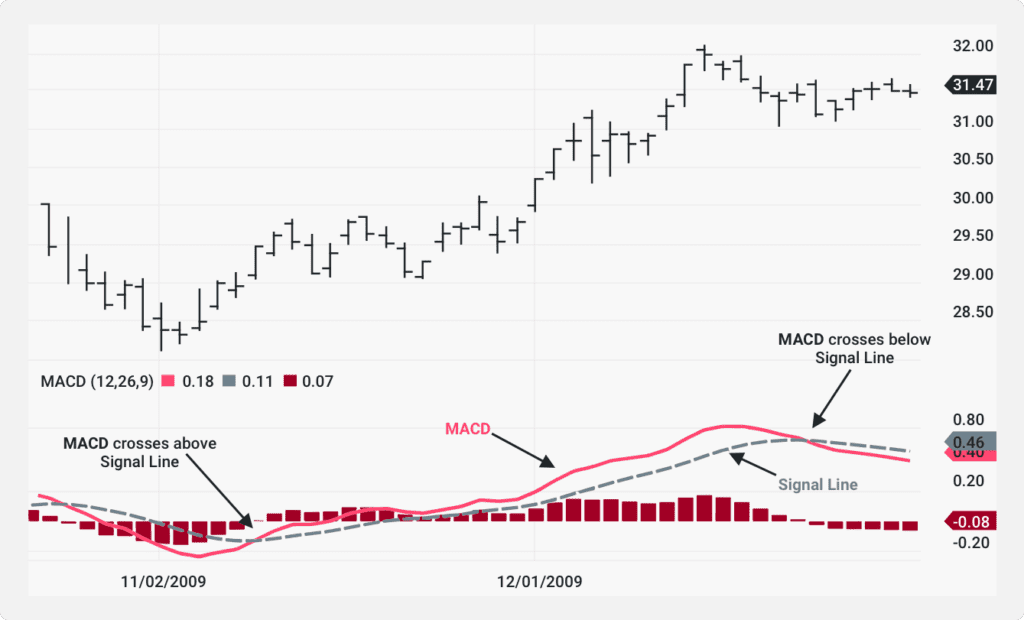
When the MACD line rises above the signal line, it indicates a bullish trend (breakout). Conversely, when it crosses below, it suggests a bearish movement (breakdown). A divergence between the MACD and the price can often hint at an impending price reversal.
Chart Patterns
Patterns like triangles, channels, and rectangles can help identify potential support and resistance levels. Formed by price movements, these patterns can be precursors to impending breakouts or breakdowns.
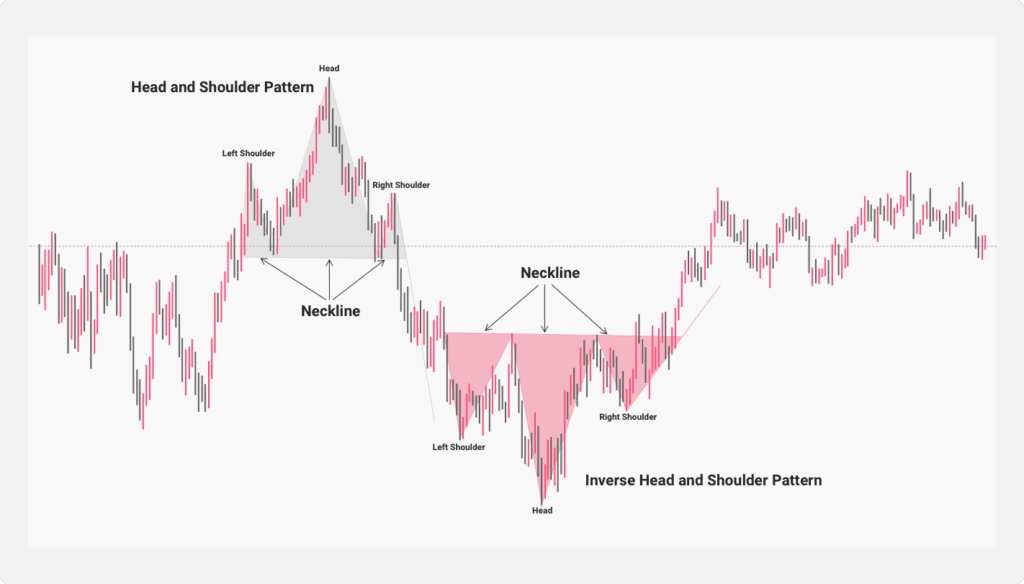
For instance, the ‘Head and Shoulders’ chart pattern is a reliable indicator of a forthcoming shift in the prevailing trend. This can hint at a potential breakout or breakdown in the subsequent trading sessions.
Trading Breakouts and Breakdowns
By trading breakouts and breakdowns, traders can capitalize on anticipated momentum and spikes in volatility. After spotting a breakout or breakdown, there are three crucial steps to maximize the opportunity:
1. Defining Entry Points
Timing is essential when trading breakouts and breakdowns. The precise moment of entry and exit can determine between a profitable trade and a loss-making one.
Every trade has inherent risks, but inopportune timing can amplify these risks. For example, entering prematurely might trap you in a false breakout, leading to unwarranted losses. Conversely, a tardy entry might result in missing the prime profit potential.
The same logic extends to exit points: exiting too soon can result in unrealized potential, while dallying can transform gains into losses.
Defining the Optimal Entry
For breakout trades, it’s paramount to await confirmation that the price has genuinely surpassed the resistance level (in the case of bullish breakouts) or dipped below the support level (for bearish breakdowns). This affirmation can be discerned from a robust trading volume accompanying the breakout, bolstered by technical indicators like the RSI and MACD.
For instance, if you’re considering a stock that transcends a notable resistance level and this breakout is paired with a spike in trading volume and an overbought condition on the RSI, it can serve as a strong endorsement for an entry point.
2. Knowing When to Exit the Trade
Breakouts and breakdowns, while enticing, don’t offer a surefire path to profits. The unpredictable nature of market dynamics means a breakout could encounter new resistance, and a breakdown might stumble upon unforeseen support. Hence, it’s not just about hopping on the ride but also knowing when to get off.
Defining the Optimal Exit
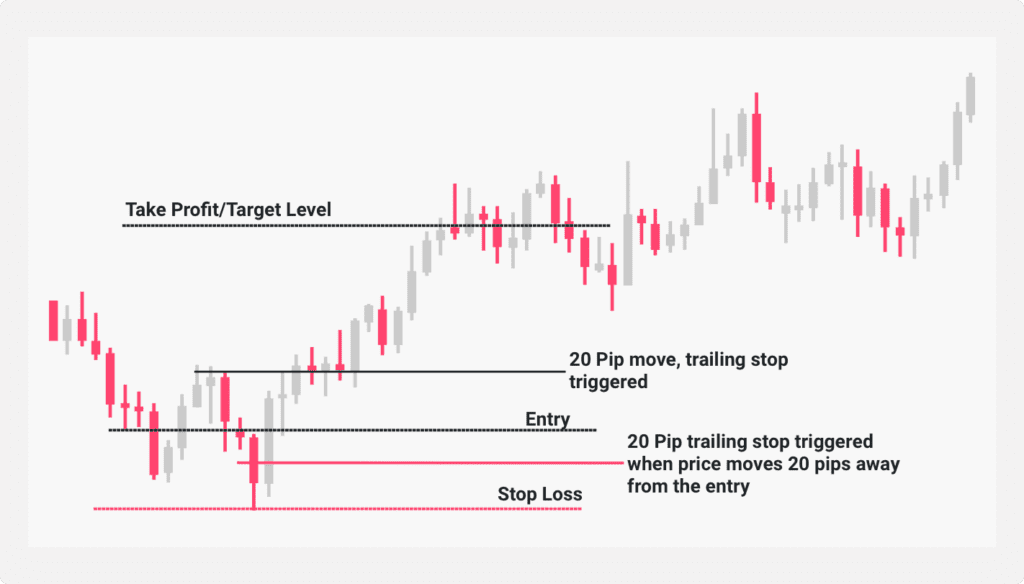
Astute traders frequently set stop-loss and take-profit thresholds to safeguard their positions.
Your stop-loss order should be positioned slightly below the closest support level or at a threshold consistent with your risk appetite. For instance, if the price dips below a pivotal support level, consider placing your stop-loss order just beneath that mark to minimize potential losses.
Conversely, a take-profit order designates the price at which you’ll conclude a trade to safeguard profits. Identify this based on resistance levels. If you’re navigating a breakout and earmark a resistance level as your target, position your take-profit order just beneath it to secure profits prior to any possible reversals.
Staying abreast of global events is also pivotal. Market news can catalyze abrupt price fluctuations. Being alert during key announcements is imperative. For instance, pharmaceutical stocks often oscillate rapidly in response to FDA announcements.
3. Utilizing Indicators for Breakout and Breakdown Trading
Spotting breakout and breakdown opportunities often hinge on discerning specific chart patterns and corroborating these with technical indicators. Here’s a snapshot of indicators and chart patterns instrumental for such trades:
Cup-and-Handle
The Cup-and-Handle pattern resembles a teacup. The ‘cup’ embodies a bowl-like consolidation, while the ‘handle’ suggests a minor decline preceding a potential breakout. A price surge above the handle’s resistance can signal bullish intent.
Flag Formation
Flag formations are small rectangular shapes that counter the dominant trend, similar to a brief pit stop in a race. The continuation of the flag typically aligns with the ongoing trend direction. Bull flags slope down, while bear flags slope up.
Head-and-Shoulders
True to its name, this pattern showcases three peaks: a central, taller ‘head’ nestled between two shorter ‘shoulders’. A rising (bullish) head-and-shoulders signals a potential breakout above the right shoulder. In contrast, a descending (bearish) formation suggests a breakdown beneath the right shoulder’s nadir.
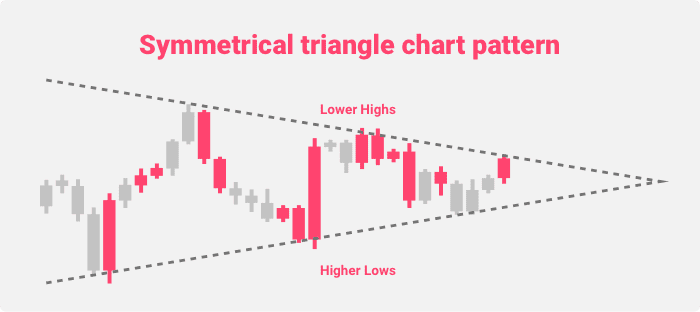
Symmetrical Triangle
This pattern emerges when descending resistance and ascending support levels converge. The situation resembles a tightening grip, with the ensuing breakout/breakdown typically mirroring the antecedent trend’s direction.
Things to Watch Out For
Successfully trading breakouts and breakdowns is as much about sidestepping pitfalls as it is about seizing opportunities. Here are essential guidelines to adhere to:
1. Be Patient and Honor Your Entry and Exit Points
Patience is a cornerstone of successful trading. Once you’ve established your ideal entry and exit points based on careful analysis, it’s crucial to stick to them. Deviating from this strategy can lead to missed opportunities or increased risks.
2. Avoid Fakeouts By Allowing the Price to Retest
False signals, or fakeouts, are a common challenge in breakout and breakdown trading. To counter this, it’s wise to allow the price to retest its levels. If it remains stable, your breakout or breakdown is likely genuine. If it reverses, you’ve successfully evaded a potential pitfall.
3. Know When Your Trade Has Failed
No strategy is perfect 100% of the time. It’s essential to remain vigilant and recognize when a trade isn’t progressing as planned. Should the market not respond as anticipated, act swiftly: exit the trade to curtail losses and free up resources for more promising opportunities.
4. Watch Out For the Volatility
Market volatility, while sometimes indicating strong sentiment, can also bring about abrupt and unpredictable price movements. These erratic shifts might prematurely trigger stop-loss or take-profit orders or even lead to false breakouts. Always be prepared for volatility’s challenges and adjust your risk management mechanisms accordingly.
5. Consider the Trading Volume
The trading volume offers a glimpse into the momentum behind a breakout or breakdown. High volume typically underscores the move’s legitimacy, while low volume might hint at the possibility of false signals. Always incorporate trading volume insights when weighing potential trades.
Conclusion
Engaging in breakout and breakdown trading can profoundly influence your trading outcomes, presenting a plethora of lucrative opportunities. However, like every trading strategy, it’s an art that demands continual adaptation and learning. This guide offers a solid foundation, but the trading world is vast and ever-changing.
Dive deeper and expand your knowledge by exploring our “Survival Guides” section.