Last Updated on October 12, 2023
The Wyckoff Theory revolves around the accumulation/distribution and supply/demand for a particular investment. This trading method has been around since the 1930s and is still relevant today. While most of us tend to associate the Wyckoff Theory with stock market investments, it applies to any investment.
What is the Wyckoff Theory?
It is fair to say that Richard Demille Wyckoff was ahead of his time concerning his technical approach to stock market investment. Born in 1873, Richard Demille Wyckoff worked his way up from the bottom, taking a job as a stock runner aged just 15. He was head of his own company in his 20s, the editor of The Magazine of Wall Street (more than 200,000 subscribers at its peak), and recognized as a leader in technical analysis.
Wyckoff was interested in the inner workings of markets. He studied tape reading and took a significant interest in how the investment companies operated. It isn’t easy to put into words Wyckoff’s impact on technical analysis. For example, he was the first to identify the “smart money” concept – how large operators accumulated and distributed stock often discourage retail investors. His legacy after his death in 1934 was the school he founded, which later became known as the Stock Market Institute. His methodologies are still widely in use today. However, what does Wyckoff’s theory mean in practice?

What is the Wyckoff Method?
The Wyckoff Method created the “Composite Man,” describing stock market investment as a “game” to understand how stock prices fluctuate. His method of identifying trading positions centered on this theoretical figure – consider market fluctuations, a combination of investment by numerous bodies, as if carried out by one person, the Composite Man. In effect, he was promoting the notion that stock prices are manipulated. If you play the game like large investors, you will make significant gains.
After many years of observing and documenting the activities of large operators, Wyckoff identified four main activities of the Composite Man:
- All activities of the Composite Man are planned in minute detail.
- First, this mythical figure will accumulate stock at low levels via several relatively small transactions. Then, after creating a rather prominent position, the Composite Man will carry out several large transactions to “promote” the stock. This practice gives the impression of a broader interest in the stock. In many ways, it can become a self-fulfilling prophecy.
- Retail investors can identify stock accumulation and distribution periods by studying individual stock charts. This gives you an understanding of the activities and motives of more prominent investors.
- The better you align your thoughts and ideas with the Composite Man, the greater the potential to begin accumulating the stock at lower levels. The Wyckoff method allowed investors to identify these activities early, maximizing potential profits.
In theory, the idea of understanding the motives and activities of the Composite Man allowed retail investors to benefit from market manipulation effectively. Moreover, the Wyckoff theory and methodology make sense when considering the cumulative strength of large investors in a particular stock against relatively small retail traders.
Wyckoff Method Rules
The five-step approach to the Wyckoff Method is as follows:
- Underpinning this approach is understanding the broader market, the present position, and likely future trends. This will identify markets likely to trade higher, lower, or sideways.
- Once you understand the probable direction of the market, it is time to identify stocks that have historically followed the same trend. You are looking for more robust investments on the upside and weaker ones on the downside.
- Point-and-figure charts will help you identify potential investments equal to or exceeding your minimum objective. Individual stocks need to have what Wyckoff described as “cause”, which is early-stage accumulation or re-accumulation of stock. This also works on the downside, distribution, and redistribution of stock.
- Rather than focusing your thoughts on one individual stock, Wyckoff recommended taking a more expansive approach and ranking individual stocks in order of preference. This preference was based on a stock’s “readiness to move”, as indicated by trading ranges and instances of stock accumulation and re-accumulation, distribution, and redistribution.
- Time your investment plans to benefit from a broader stock market trend change. Then implement stop-loss limits, follow the stock price and market index until the trend changes.
It all makes sense when you see the simple five-step approach to Wyckoff trading. However, putting the Wyckoff theory and methodology into practise takes time and patience.
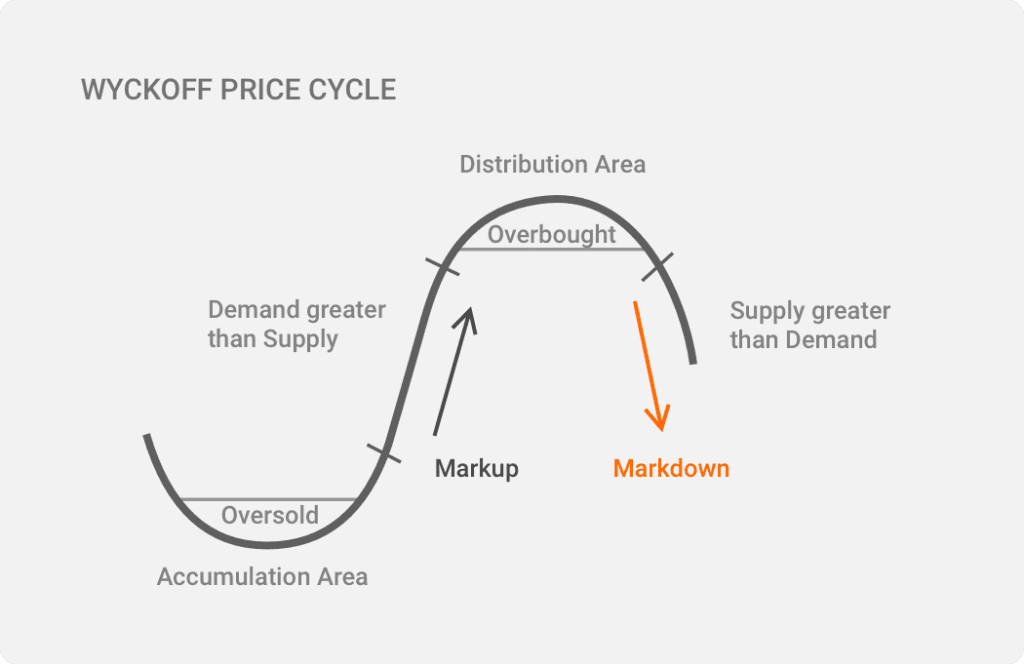
1. The law of supply and demand
Central to any stock price movement is the law of supply and demand. If supply is more significant than demand, a stock price will fall. Where demand is greater than supply, a stock price will increase. The following graph demonstrates this:
Using the Wyckoff method, when large investors begin to accumulate or re-accumulate stock in an individual company, it tends to start in a relatively subtle manner. If the stock price is trading downward, this will likely attract sellers, with prominent investors picking up any loose stock. This can become a self-fulfilling prophecy where a stock continues to fall, especially with a sudden crash below a trading range support level. Time and time again, you will see substantial trading volumes in a particular stock just before a turning point in the trend – this can be on the upside or the downside.
Wyckoff believed that market manipulation allowed large investors to challenge the confidence of retail investors. This could create momentum on the upside or the downside and let large investors take a contrary position. Eventually, the imbalance between sellers and buyers will be rectified, prompting a period of consolidation. When buyers take over, the lack of supply will increase the price. This is why you often see a share price moving higher on relatively low volumes after the trend has turned.
A market example
The following chart of the E-Mini S&P 500 futures contract perfectly illustrates a gradual sell-off culminating in a spike in volume when the trend is about to turn. As more buyers then emerge, even on reduced volumes, there is an imbalance between supply and demand which pushes the futures contract higher:

The best way to describe this sudden spike in volume is a break in investors’ confidence in a stock or an index. For example, many may have been holding off selling particular security only to see it continue to trend downwards until they eventually give in, sell off, and take a loss. On the upside, as you saw with the technology sector in recent years, investors hold off buying into the trend only to see the industry continue to register significant gains. Eventually, they join the party, leading to a spike in volume, pushing the price to an overbought position.
In hindsight, these patterns are very predictable. Using the Wyckoff Method, it is possible to identify those accumulating stock on the cusp of a change in trend.
2. The law of cause and effect
Akin to planting seeds and witnessing growth, it is scarce that a change in security price happens out of nothing. There needs to be a cause to create an effect. As you see from the graph below, there tends to be a trading period within a relatively tight range. This is called the cause, with the effect being the eventual decline in the price.

On the upside or the downside, the impact will depend upon the duration of the cause period. The longer the cause period, the more pent-up sellers or buyers and, therefore, the greater the impact when it finally breaks out of the trading range. While many securities, such as the E-mini S&P 500 futures contract, will see numerous causes and effects daily, this period could take months or even a year to come to fruition with some assets. Patience is a virtue!
3. The law of effort vs results
The concept of effort versus results is fascinating and a powerful indicator of a changing trend. In this scenario, the effort is the trading volume, and the result is the change in the price. As you will see from any security price graph, where security moves out of a trading range requires a significant volume boost. This may be in the form of an increased number of sellers/buyers, depending on the direction of movement. Therefore, in theory, there is a strong link between effort and results but is this always the case?
When a trend ends, as shown in the graphs above, there is often a massive spike in volume but minimal movement in the security price. Where the security price has previously been trending down, this is an indicator that large investors are starting to mop up the loose stock. On the upside, this is often a sign of the final flick of the tail of an uptrend.
Retail buyers continue to push the stock higher and higher while large investors feed this demand. Once the demand for the stock has gone, the stock can often plummet. This is due to the imbalance between sellers and buyers. So, where there is a significant hike in volume but minimal movement in the security price, this is very often an indicator the trend is about to change. While this is a simple observation, it can be highly effective.
How can you use the Wyckoff Method?
The key to using the Wyckoff Method to trade securities, futures, or any other type of investment is recognizing the top and the bottom of a trend. As we have touched on above, there are numerous indicators such as:
- A massive spike in volume but limited movement in price.
- A prolonged period of trading within a tight range followed by a sharp move upwards or downwards.
- Prominent investors are beginning to turn positive, in the public domain, on an index or asset.
Distinguished investors are well aware that many retail investors use different forms of technical analysis to dictate their stop-loss limits. Consequently, one of the often forgotten signs of a change in trend is a sharp movement outside of a trading range, followed by a spring back to within the range. This will often trigger stop-loss limits or, with a security price, maybe a fall below $10, $20, or $30, a superior level. As a retail investor, would you usually have the nerve to hold on if your stop-loss limit was broken, but you suspected this might be due to market manipulation?
Wyckoff Trading Strategies
There are many ways to interpret the Wyckoff Method and theory to create a robust trading strategy. Looking at ways of accumulating stock using Wyckoff trading methods will give you an idea of the risk/reward ratio.
Range bound trading
During the cause and effect period, that time when large investors begin to accumulate stock, you will likely see the creation of a trading range. While it will ultimately depend on whether the security breaks out on the upside or the downside, those investors happy to take a degree of risk could buy at the bottom of the trading range. With a relatively tight stop-loss limit, the purchase could be well-timed, just before a breakout on the upside.
Buy on the breakout
The breakout from any trading range results from significant effort (demand), leading to enhanced results (price movement). However, as we touched on above, due to manipulation, you may see temporary breakouts that quickly turn downwards back into the trading range. Those who buy on the first sign of a breakout are taking a risk, although setting a stop-loss limit below the initial spring level will offer a degree of protection.
Well defined change in trend
This takes us back to the cause and effect principles of the Wyckoff trading mythology. If there has been a prolonged period of cause, then, in theory, the effect should be more significant once the trading range is broken. Therefore, while many may see buying into a more defined change in trend as a lower risk approach, it will depend upon the cause, which will impact the ultimate effect.
A helpful example of this would be the Covid lockdowns experienced across the globe. Where the lockdown period is relatively short, people tend to be more relaxed. However, if the lockdown period is prolonged, they will become more desperate to experience their previous freedoms. Consequently, when they finally “breakout”, their activity levels are likely to be much higher, making up for the lost time. Akin to winding up an elastic band, the more it is wound up, the greater the power and momentum this creates.
Even though we have highlighted the use of the Wyckoff trading theory to accumulate stock, it is precisely the same concept when looking to dispose of a stock. The only difference is that you would be looking to sell into strength to take advantage of retail buyers.
Wyckoff Method Advantages and Disadvantages
There is no doubt that Richard Demille Wyckoff has had a profound and prolonged impact on trading strategies and technical analysis. However, like any investment strategy, the Wyckoff Method has significant advantages and disadvantages. The theory and the methodology make perfect sense when you read them in-depth. But unfortunately, markets don’t always move in the manner we expect.
Advantages
When using the Wyckoff trading method, there are several advantages which include:
- Change in trend coupled with market upturn increases momentum.
- Spikes in volume but limited price movement indicate the balance of supply/demand is changing.
- Akin to a coiled spring, the longer the period of cause, the greater the effect.
- This method can apply to any investment. However, most traders associate it with securities, commodities, and derivatives.
The idea that market prices are manipulated to disadvantage retail investors may seem like a wild conspiracy theory. But check out the graphs. How often do you see a share price move before a positive or negative announcement? You will be surprised.
Disadvantages
When looking at the Wyckoff theory, it is difficult to pinpoint any disadvantages in the long term. While sudden market movement, or geopolitical issues, could scupper a trading strategy in a split second, this is the unpredictable side of the investment. There are very few disadvantages to the Wyckoff method, although you need to be aware that:
- You may see several false flags before a firm change in trend.
- The cause period can be extended, leading to some investors losing patience.
- How soon you act during a changing trend depends on your attitude to risk.
Everything is relative in the investment world. Therefore, an unexpected shift in the market could scupper your Wyckoff trading theory. Consequently, you must have a stop-loss limit and abide by it. They are there for a reason.
Final Thoughts
The “Composite Man” idea was a game-changer, and Richard Demille Wyckoff quickly became one of the leading lights in technical analysis. Allowing retail investors to visualize an individual sitting behind a desk, pulling all of the strings, and manipulating markets brought the Wyckoff theory to life. Whether or not you buy into the idea, there is no doubt that physical data back up the evidence in the shape of chart after chart. The detailed analysis of how large investors accumulate stock, manipulate prices, and then promote their positions with more visible large transactions was and continues to be ground-breaking.
While many trading philosophies tend to be self-fulfilling, often in hindsight, the Wyckoff method seems to tap into the minds of large investors, who often treat retail investors as sheep. The fact that the principles of the Wyckoff trading strategy remain as strong today as they were nearly 100 years ago says everything.