
Last Updated on April 12, 2024
Multiple timeframe analysis is an extremely popular trading approach. Used correctly, it allows you to assess the market’s performance at different time intervals, helping to identify optimal entry and exit points.
In this article, we’ll delve into multi-timeframe analysis, exploring its significance and how it can provide a competitive edge in the market. Specifically, we’ll look at:
What is a Time Frame?
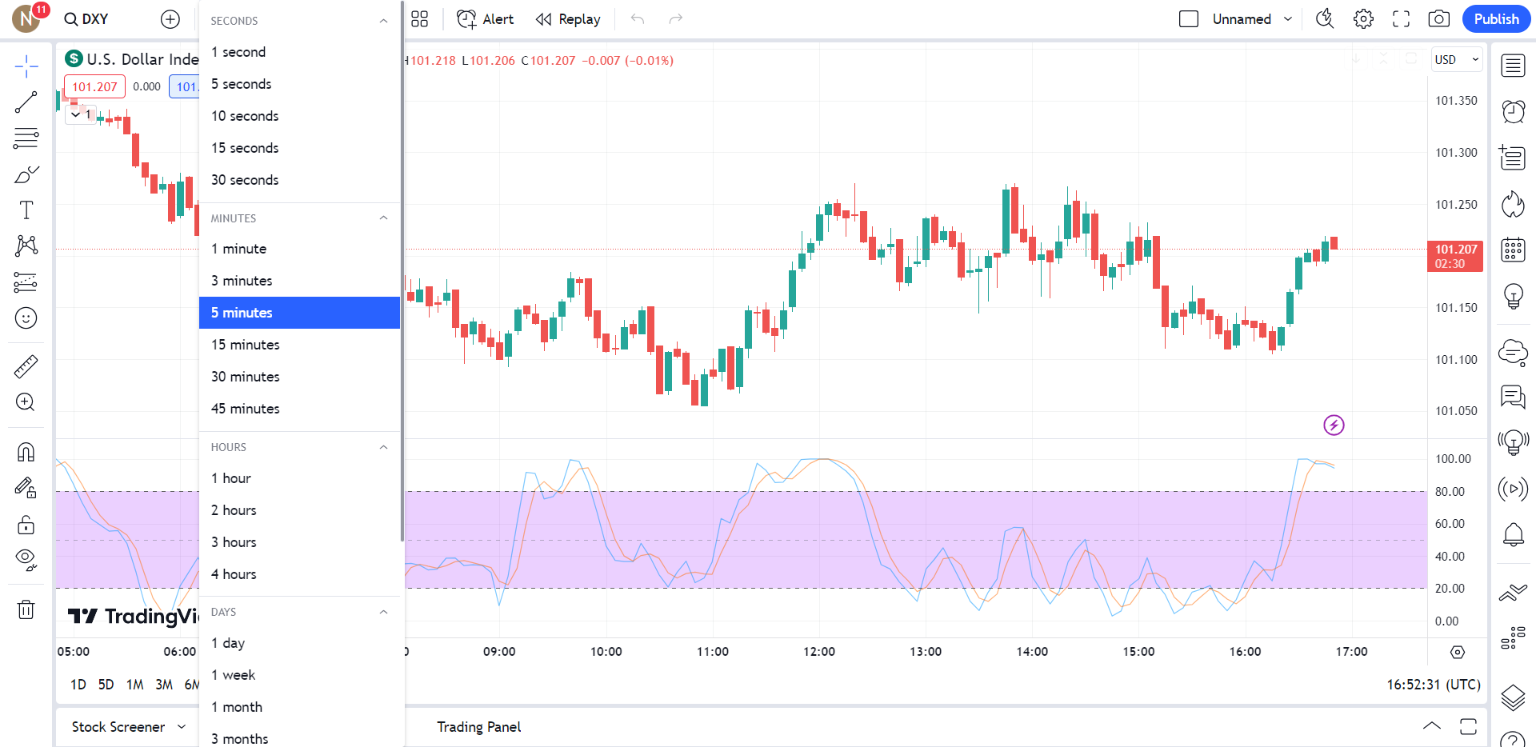
In trading, a time frame refers to the specific period represented by a single bar or candlestick on a chart. This time frame can range anywhere from one minute to one month or more.
Each bar or candlestick on the chart displays information about price movements — such as the opening, closing, high, and low prices — within that specific time frame. For example, on a one-hour chart, each bar or candlestick symbolizes an hour’s worth of price activity. Similarly, on a daily chart, each bar or candlestick represents a full day of trading activity.
Time frames play a crucial role in analyzing the historical price data of securities, revealing different patterns and market trends.
For instance, shorter time frames like the 1-Minute (1M) or 5-Minute (5M) charts provide a detailed view of price fluctuations within a short period, making them ideal for day traders and scalpers seeking to quickly capture short-lived opportunities.
In contrast, longer time frames like the Daily (D1) or Weekly (W1) charts offer a more comprehensive perspective. They are a perfect choice for long-term investors and position traders looking to capture broader market trends.

Time Frame Types
Trading time frames are generally categorized into three types — long-term, medium-term, and short-term. Each type caters to a specific trading style and offers unique insights into the market.
The Long-term Time Frame
It covers larger periods, typically ranging from several months to years. Traders focusing on this time frame are usually less concerned with short-term market fluctuations. Instead, they prioritize steady trends and macroeconomic factors.
The advantage of long-term analysis is its ability to filter out short-term noise, offering a clearer picture of the market’s direction. However, it’s essential to keep in mind that maintaining positions for an extended duration may expose traders to increased market volatility.
The Medium-term Time Frame
These time frames encompass an intermediate duration, usually ranging from a few weeks to several months. They allow traders to capture major price movements while also providing a reasonable level of detail. Medium-term traders often analyze hourly to daily charts over periods of weeks or months.
Swing traders and some position traders regularly refer to medium-term time frames to capitalize on changes in trends and price swings that may occur over a span of a few days to several weeks.
The Short-term Time Frame
It represents the most detailed level of price data, varying from minutes to a few hours and seldom extending beyond a day. Day traders and scalpers primarily utilize short-term time frames to profit from swift market fluctuations throughout the trading day.
However, while short-term trading can present opportunities for quick gains, it demands an increased focus and advanced risk management as the markets can be highly volatile at this level.
Understanding Multi-Timeframe Analysis
The multi-timeframe analysis is a strategic approach in trading where the same security is examined across different timeframes. Traders use it to gain a more comprehensive, layered understanding of market trends and price movements, thereby significantly enhancing their decision-making process.
Analyzing an asset in a single time frame might cause you to overlook significant trends or patterns visible in other timeframes. On the contrary, trading multiple time frames offers a bird-eye market view.
For example, a short-term chart might show a seemingly profitable uptrend, but a long-term chart could reveal that this is just a minor rally in a broader downtrend. Without considering the larger picture, you could make a very costly error.
Moreover, multi-timeframe analysis can assist you in timing your trades more effectively. By studying how an asset behaves in different timeframes, you can better identify the optimal entry and exit points for your trades.
For instance, using a long-term chart could help evaluate the overall market trend, while a short-term chart can pinpoint specific trading opportunities aligned with it.
How to Perform Multi-Timeframe Analysis – the Different Approaches
There are two main approaches to trading multiple time frames — top-down and bottom-up analysis.
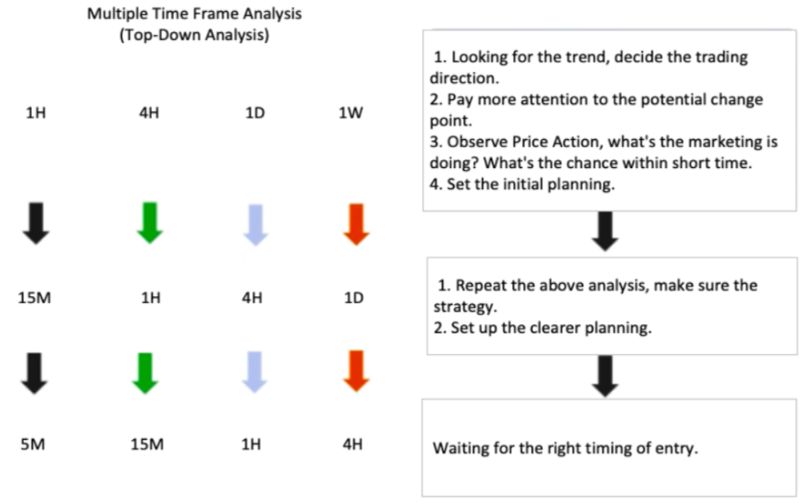
The top-down approach begins by analyzing longer timeframes first, such as monthly or weekly charts, before proceeding to daily or intraday charts. This method helps traders gain a comprehensive view of the broader market trend.
Once the primary trend is determined, they move to time frames like the 4-hour or 1-hour charts to identify potential swing points and support/resistance levels. Finally, they focus on shorter time frames like the 15-minute or 5-minute charts to precisely define entries and exits.
On the other hand, the bottom-up approach starts with short-term timeframes like hourly or daily charts and progresses to weekly or monthly charts.
Traders use this method to seek quick trading opportunities and verify their legitimacy against broader market trends. They start by scrutinizing short-term price movements and patterns on the 1-minute or 5-minute charts. After identifying potential entry or exit signals, they move to bigger time frames to evaluate the overall trend and market context.
Which Approach is Better?
Between the two, the top-down approach is often considered superior as it allows traders to first gain an understanding of the market from a macro perspective. This decreases the risk of being influenced by short-term market volatility.
Next, let’s look at how to apply the top-down approach in multi-timeframe analysis.
Medium- and Long-term Timeframes For Identifying Trends
These timeframes play a vital role in providing a broader market perspective before focusing on trade-specific details. These timeframes, which include daily, weekly, or monthly charts, offer a more comprehensive view of market trends and price movements.
It’s crucial to identify the dominant market trend early on as it typically exerts considerable influence over the price action seen in shorter time frames.
Several indicators can aid in identifying these trends. Moving averages, for example, can help detect longer-term trends. When the price is above the indicator, it signals a bullish trend, whereas if it’s below, it could suggest a bearish trend.
Another useful tool is the Average Directional Index (ADX). The ADX can measure the strength of a trend, assisting traders in determining if a trend is robust enough to justify a trade.
Short-term Timeframes For Entry and Exit Points
Short-term charts offer detailed information about recent price movements and are more responsive to changes in market conditions. This is essential when identifying the precise price levels at which to open or close a trade.
Trading in the direction of the dominant market trend suggests there are likely more potential entry or exit opportunities.
For example, if the trend is bullish on the weekly chart, you can switch to a shorter time frame, such as the 15-minute or 1-hour chart, to identify buying opportunities. Look for a temporary dip in prices or a potential bullish reversal pattern.
Short-term timeframes are also beneficial for setting stop-loss and take-profit levels. Analyzing the volatility and price swings in the short-term charts can help you identify ideal points for these tools to minimize risk and maximize potential returns.
Example of a Multi-Timeframe Analysis Strategy
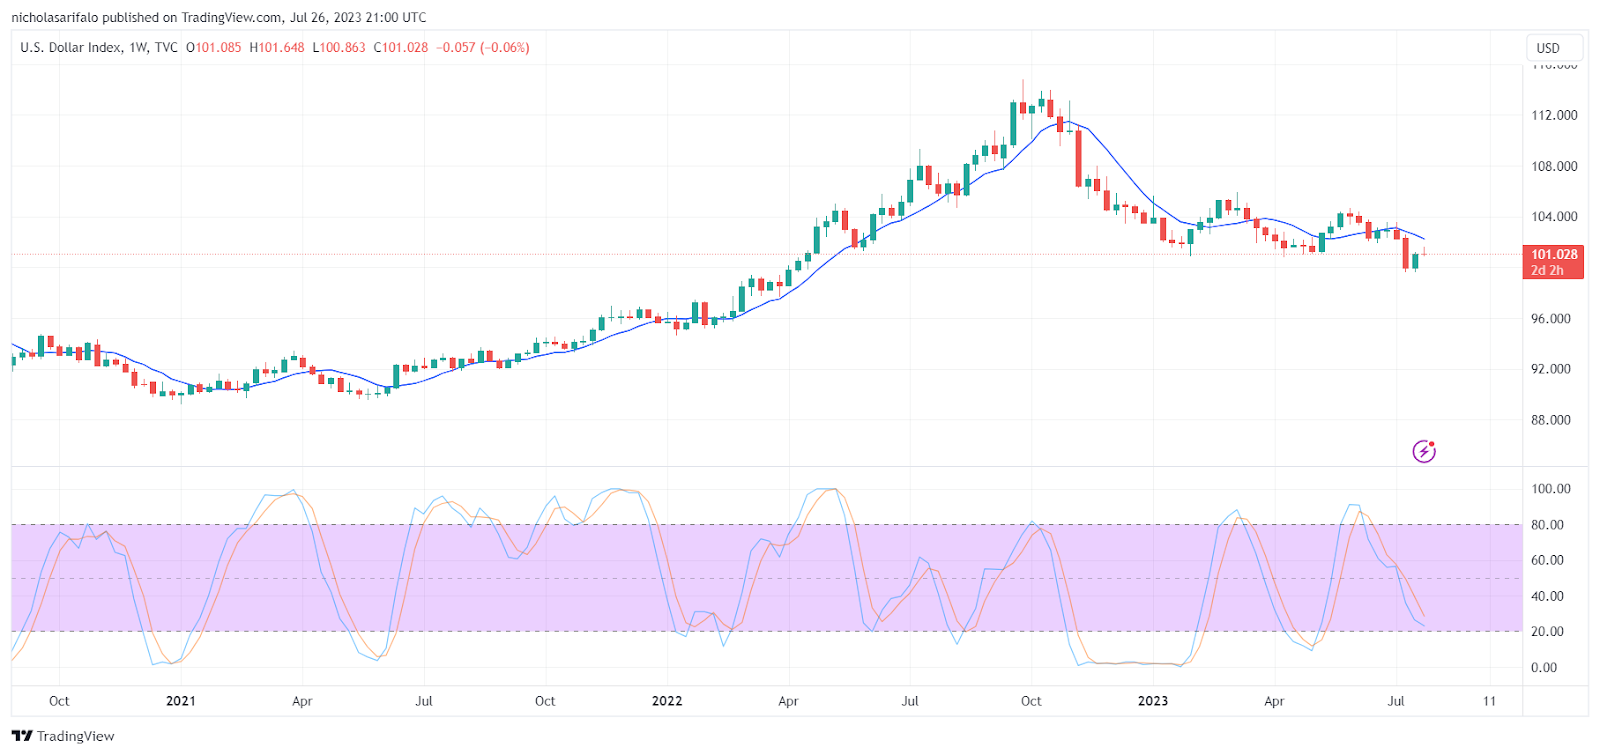
Consider a practical example of a multi-timeframe analysis strategy using the EUR/USD forex pair. For illustration, we’ll use a combination of a daily chart (for identifying the overall trend) and a 1-hour chart (for defining entry and exit points).
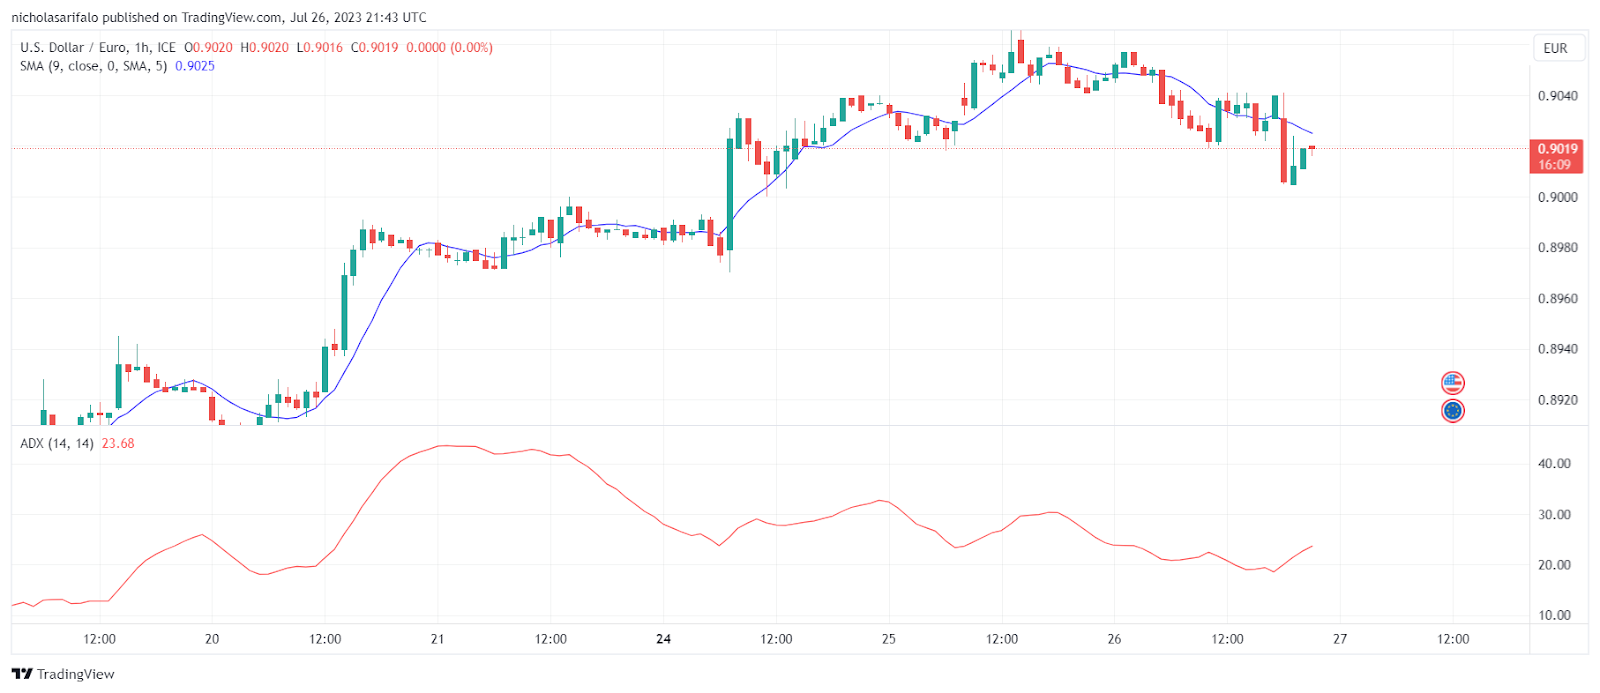
First, we examine the daily chart. Suppose we notice a strong uptrend, with the price consistently staying above the moving average. We can then double-check with the ADX indicator. In that case, it has a value above 25, indicating a strong trend. This scenario would suggest a bullish market, and thus, we should search for buying opportunities.
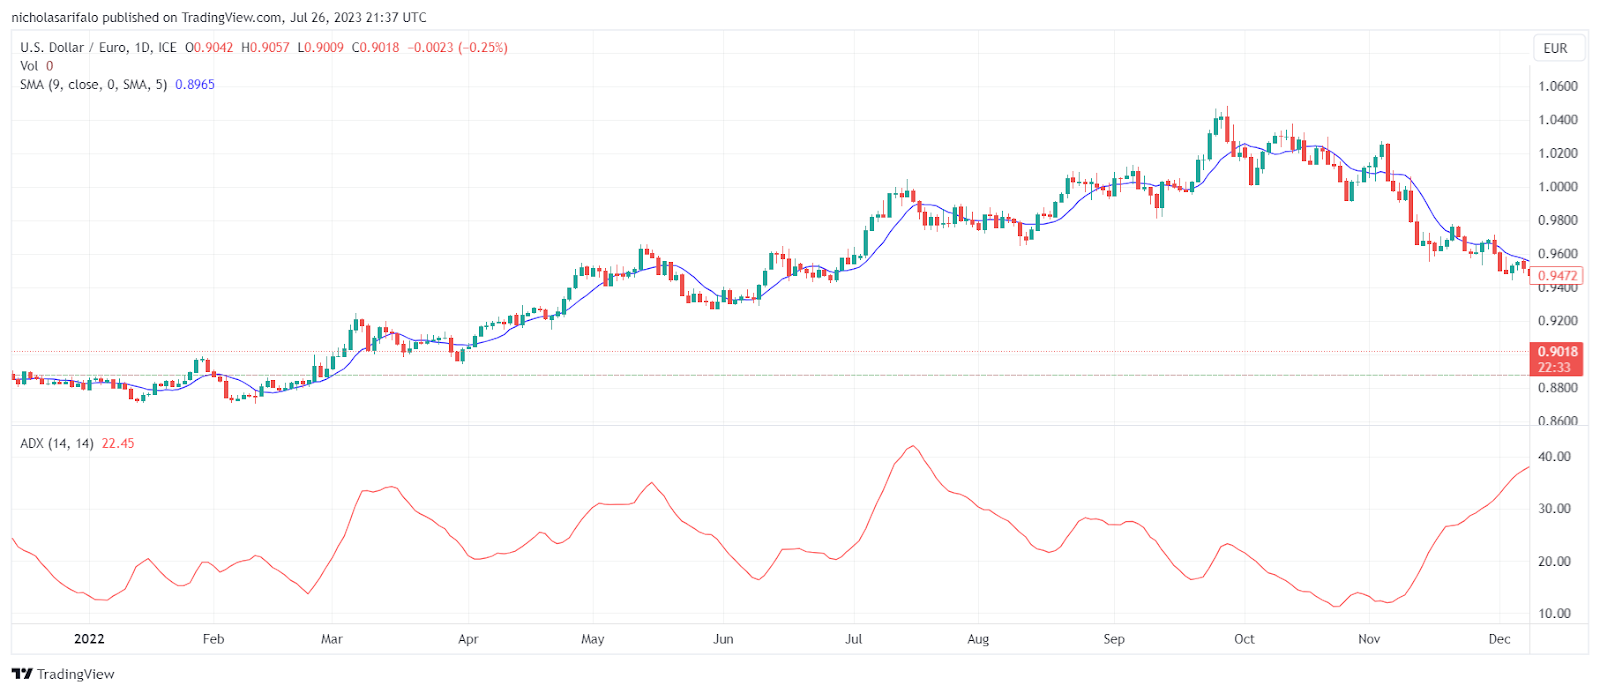
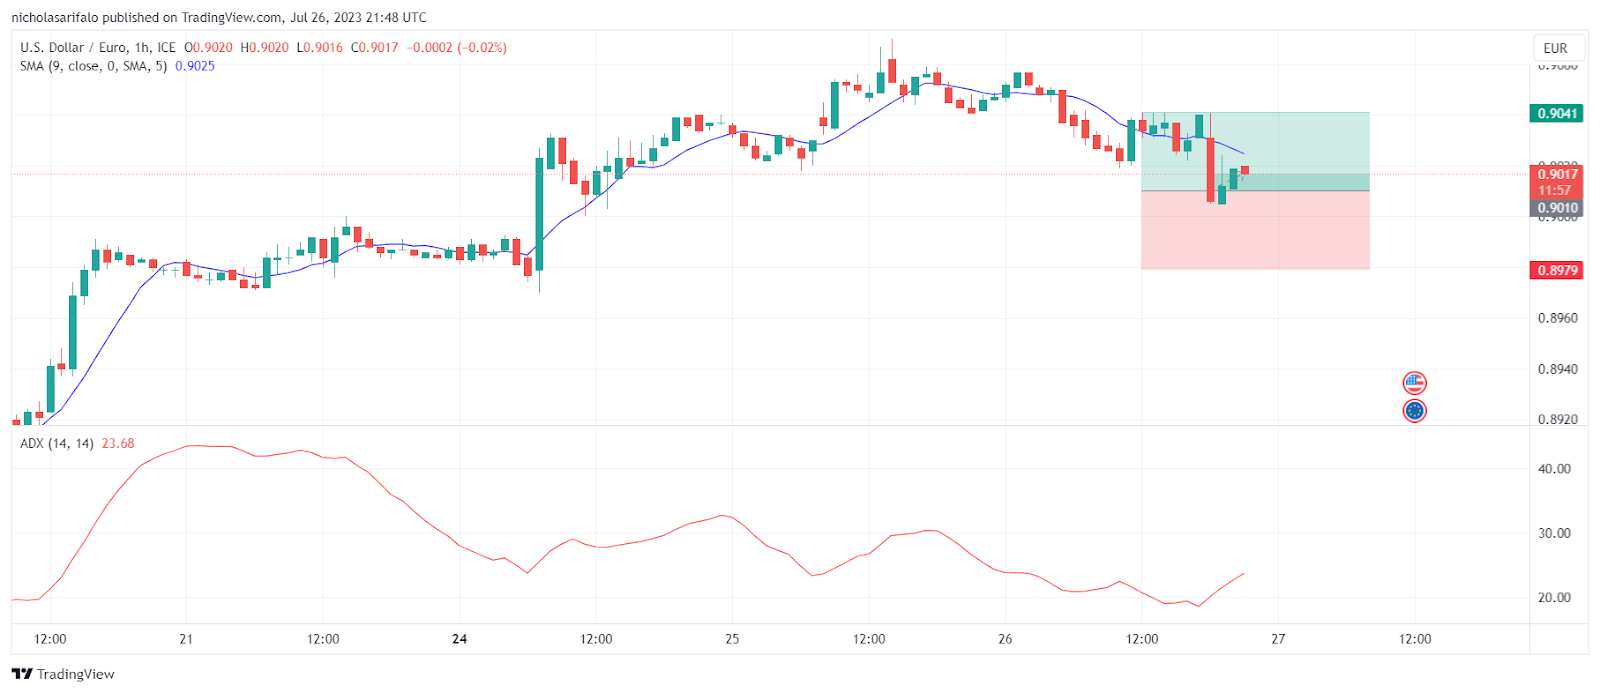
Next, we switch to the 1-hour chart to find our entry point. You’ll notice that the price experiences dips or retracements even when it is in an uptrend. So we wait for one of these temporary dips, possibly signaled by a bearish candlestick pattern or a downward crossover in a short-term moving average.
Once we identify this dip, we can initiate a long trade, in line with the bullish trend noted in the daily chart. We also set our stop-loss below the recent swing low in the 1-hour chart to limit potential losses if the price moves against us. Conversely, we place our take-profit level near a recent high or resistance level.
In this example, you can see how the short-term timeframe exhibits more volatility or “noise” compared to the long-term timeframe. The daily chart presents a clear, steady uptrend, while the 1-hour chart displays frequent price swings within this trend. By integrating these timeframes, we can align our trades with the overall trend while leveraging short-term price movements to optimize our entry and exit points.
Multi-Timeframe Analysis Tips & Tricks
- Avoid paralysis by analysis: Don’t let the information from multiple timeframes overwhelm you. Adhere to a clear trading plan and predefined trade setup criteria.
- Beware of biases: Stay away from cognitive biases, like the confirmation bias, that might skew your analysis. Make sure to thoroughly consider information from all relevant timeframes.
- Choose the right trading platform: Your trading platform should support effortless switching between timeframes and allow the use of various technical indicators.
- Educate yourself: Continuous learning is key. Resources such as “Technical Analysis Using Multiple Timeframes” by Brian Shannon and “Trading for a Living: Psychology, Trading Tactics, Money Management” by Alexander Elder can enhance your understanding of multi-timeframe analysis.
Conclusion
Multi-timeframe analysis is an essential trading tool for gaining a comprehensive view of market trends by examining multiple timeframes. Implementing this strategy can aid in understanding long-term trends and pinpointing precise entry and exit points.
A top-down approach to trading multiple timeframes ensures your trading decisions are in sync with broader market movements, enhancing the chances of successful trades.