Last Updated on September 8, 2023
Any trader will tell you that identifying trends in the market is key to making profits. The price channel trading strategy is a smart way to spot these trends and potential price breakouts and bounces within a given period. This allows you to make profitable trades. In this guide to understanding price channel trading, we’ll cover the following:
What Is a Price Channel?
In simplest terms, a price channel is a range within which the price tends to oscillate between an upper limit and a lower limit over a given period.
Too simplistic? Let’s break it down.
The price channel is a pattern on the chart represented by two parallel trend lines. The upper line is the resistance, while the lower line is the support. It’s important to understand how support and resistance work, as they will go a long way in determining where and when to place your trades.
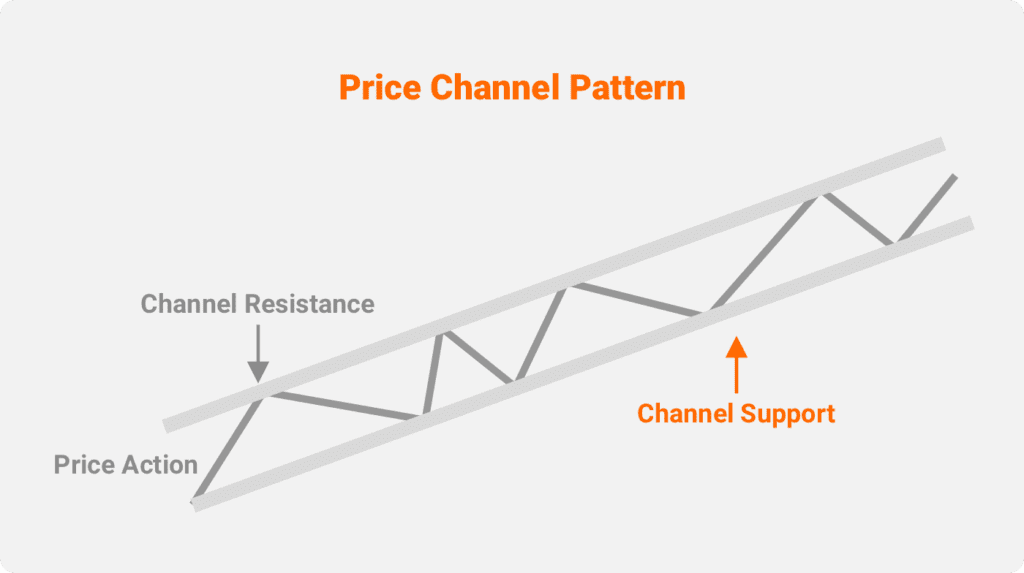
The price action for that particular security is then contained between these lines. This is where most of the trading occurs in price channel trading. A price channel forms through the interplay between the supply and demand for that particular security. This, in turn, influences the price movements, which traders are eager to capitalize on.
There must be a wide enough space between the two trendlines, allowing for ample price movements if you want to trade inside the channel. These price actions are where your potential profits lie.
Price channels can be created by all types of traded securities and instruments, including stocks, Forex, mutual funds, futures, exchange-traded funds (ETFs), and more. They can also occur over various time frames, so it’s up to you to decide what price action periods you want to analyze.

WHAT DO PRICE CHANNELS TELL YOU?
Price channels are used by traders with a keen understanding of technical analysis. The information it provides allows them to gauge the momentum and direction of a trend, which they then use to identify profitable trading channels.
If the price channel is trending upward over a given period, we can safely assume it’s a bull market. If trending downward for a prolonged period, we can assume it’s a bear market.
Price channels also help you identify support and resistance levels, both fundamental to any trading strategy. They allow us to spot ideal entry and exit points on the chart.
The support level is a key area from which the price always bounces back up. In the market, the bulls defend this support level to push it higher over subsequent trading sessions. Conversely, the resistance level is the critical area from which the price simply can’t break through. It almost always comes back down. This area is defended by the bears.
Once plotted on the chart, you can simply use the price channel to buy at the channel support level because you’re expecting the price to bounce back up. You also sell at the channel resistance level since you’re expecting the price to come back down.
Price Channels Are Also Useful in Identifying Breakouts
A breakout is when the price of the security breaks past the upper or lower channel trendlines. Breakouts can signal a fresh bullish rally (breakout past the resistance) or a more severe price drop (breakout below the support).
In any case, breakouts offer the biggest trading opportunity in price channel trading. This is because breakouts can produce significant price movements in a particular direction. If you place your trades at the right time, you can ride these massive price movements and rake in some handsome profits.

Types of Price Channels
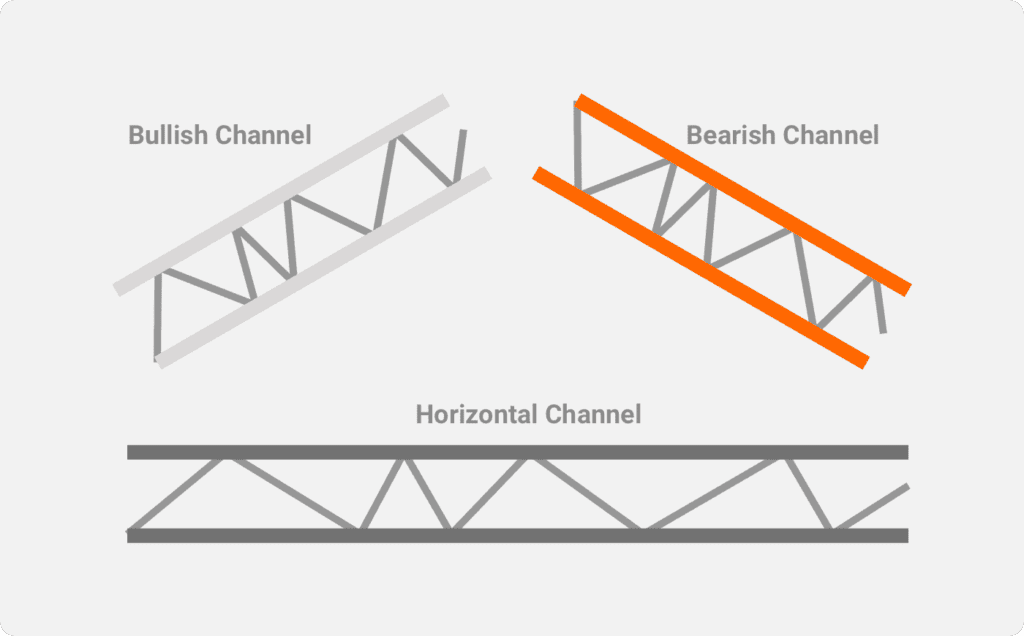
Depending on the direction of the underlying trend, the price channel may be categorized into three main types:
- Bullish channel (ascending trend)
- Bearish channel (descending trend)
- Horizontal channel (sideways trend)
Let’s look at each one in detail so you understand how trades and profits are made.
BULLISH PRICE CHANNEL TRADING
This when the price action occurs between upward sloping trend lines, hence the name ascending channel. The price is moving higher and establishing higher highs and higher lows. Higher highs are often a signal that the trend is likely to continue, while lower lows can change trend direction.
The trend lines help form the channel, with the upper line drawn across pivot highs and the lower line drawn across pivot lows. This reveals the support and resistance areas for price targets.
The trader can swing trade or follow the trends in a bullish price channel as the price oscillates from support to resistance. They can also look out for breakout opportunities and go long as the price starts to near the resistance line or slightly surpasses it.
BEARISH PRICE CHANNEL TRADING
This is when the price action of the security occurs within two downward-sloping trend lines. The price is moving lower and is recording lower highs and lower lows over a given period. Consistent lower lows signal a continuation of the trend.
In a descending price channel, traders will often go short to profit from the downward market movement. They also look to hedge any long positions that they might have at the time.
It’s important to pay close attention to the trend because once completed and the underlying price starts to ascend, they can open a long position and ride the expected rise in price.
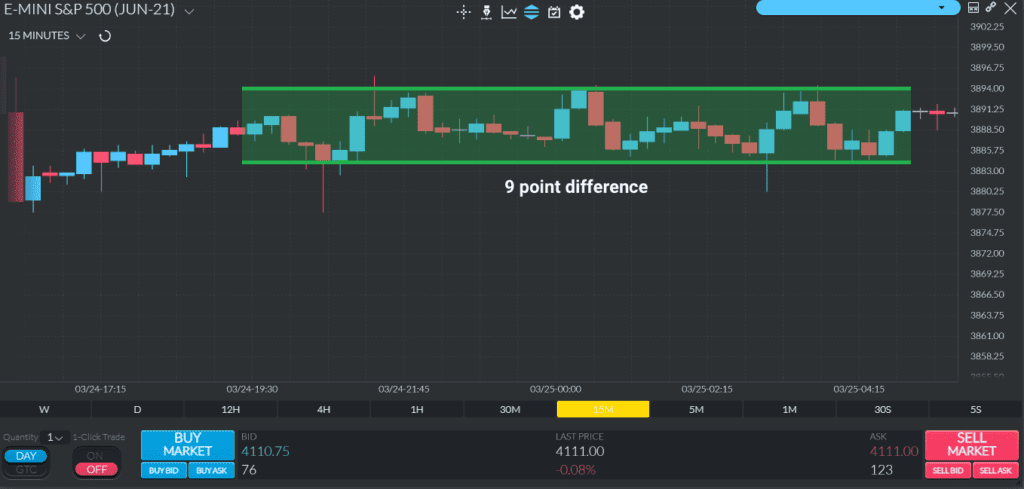
HORIZONTAL PRICE CHANNEL TRADING
This is when the price action occurs within two horizontal trend lines. Basically, the trend is just moving sideways with no clear signal as to whether the market is bullish or bearish. This essentially tells you that both buying and selling pressure is in equal measure.
In a sideways price channel, the most common approach is to trade at the support and resistance levels. However, it’s important to watch the momentum build and increase volume as both signals prelude to an impending breakout.
Several technical indicator tools can help in this regard, such as the Accumulation/Distribution (A/D) line and the On-Balance Volume (OBV). Once the change occurs, the trend will go upwards or downwards, and then you can begin creating a new price channel.
How to Identify a Price Channel
Technical traders are always on the lookout for patterns that can enable them to make informed trades. In the case of price channels, it’s all in the chart. Whenever the price of the security moves within a defined range over a given period, that’s already a price channel — you just need to know how to identify it.
That’s easy too.
You’re looking for the price to have established a set of highs and lows following a discernible pattern. Once you’ve identified the pattern, you just draw the parallel lines on either side of the price line and in the same direction.
If the price has been consistently moving up within the pattern, you’ve got an ascending price channel. If down, descending price channel; and if sideways, horizontal price channel.
HOW TO DRAW A PRICE CHANNEL
Drawing a price channel is just a matter of drawing two lines — the main trend line and the channel line, both are parallel and follow the chart’s price action. Find two tops (pivot highs) and two bottoms (pivot lows) over a given period and draw the lines.
The price action over that period will signify whether it’s an ascending, descending, or horizontal channel.
You have now drawn your price channel.
Continue tracking it and connecting two tops and two bottoms, extending the lines further until the price action breaks outside the line for a sustained period.
WHY IS A PRICE CHANNEL CONSIDERED A SELF-FULFILLING PROPHECY?
Because it’s a discernible pattern, and as more and more people follow the pattern, the market responds accordingly.
For example, let’s say the price has been steadily posting higher highs and higher lows for the past three trading sessions. You’ve got a bullish price channel. The more traders spot this pattern, the more they are likely to trade within the channel.
So when the price reaches the bottom of the channel, they believe that it will rise again, so they buy. If most of the market is buying at that time, the price actually goes up as anticipated. When the price hits the top of the channel, they expect it to come back down, so they sell. The market responds accordingly, and the price drops.
Essentially, these traders’ sentiments are actually fueling these price actions. And that’s why it is considered a self-fulfilling prophecy.
Price Channel Trading Strategies
There are two main trading strategies when using price channels — the bounce and the breakout/breakdown.
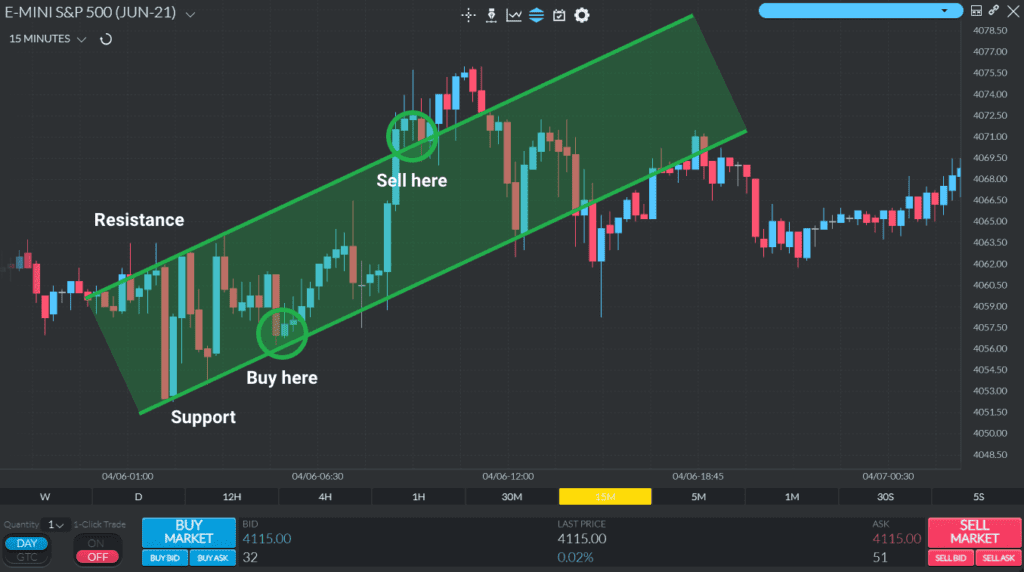
TRADING THE BOUNCE
This just means trading within the channel. So you’re following the price action and trading at the support and resistance levels.
Identify the two tops and bottoms on your chart and draw your lines. Make sure to study the pattern. When the price approaches the channel boundary next, you open a trade expecting the price to bounce in the other direction.
Let’s say the price is approaching the upper trend line. You sell because you’re expecting the price to go down at the resistance level. When the price goes down and nears the lower trend line, you buy because you’re expecting the price to reverse at the support level.
This trading against the trend strategy applies to all types of price channels. The important thing is that you’re placing your trades at the right places.
Another key consideration is your aggressiveness as a trader. Some traders may not be as aggressive as wanting to trade against the trend. So instead, they follow it.
Essentially, they wait for the price action to begin in the expected direction before placing their trades. Once it starts to go up, they buy and wait for the pivot. When it starts to go down, they sell. These are the basics of trend trading.
TRADING THE BREAKOUT
Done correctly, trading the breakout can bring in significantly more profits compared to trading the bounce.
This is when you anticipate that the price will break outside the channel instead of pivoting at the boundaries. You then place a buy order when the price crosses the upper trend line or sell when the price breaks below the lower trend line.
One of the best opportunities for breakout trading is when you have a horizontal price channel. Since there’s no prevailing direction, a breakout in either direction is very likely to occur in the subsequent trading session.
When trading the breakout, it’s important to use other indicators to confirm the trend and identify ideal entry and exit points. This also lets you determine your stop-loss and take-profit levels.
In any case, it’s always best to trade in the direction of the trend, whether you’re trading the bounce or the breakout.
Price Channel Indicators
A good trader never relies on a single technical tool for placing trades. The simple reality is that no one trading indicator can do everything, so it’s always about using two, three, or more tools to complement one another.
There are many indicators that you can incorporate into your price channel trading strategy. These indicators measure everything from volatility levels and volume to confirming or contradicting trends and spotting potential reversals and breakouts.
With that said, here are three popular price channel indicators:
DONCHIAN CHANNEL
Donchian channels compare the current price of a traded security against its previous trading ranges. This information helps denote volatility in the market and potential breakouts, reversals, and retracements.
This indicator uses three bands — Upper, middle, and lower bands. The upper and lower bands are based on the highest high and lowest low for that period. The middle band is based on the average of the upper and lower bands.
Traders use the Donchian channel to measure market volatility. Narrow bands denote stability in the market, while wide bands indicate that the market is experiencing growing volatility. This is important because it helps spot possible reversals and breakouts.
LINEAR REGRESSION CHANNEL
The linear regression channel consists of three lines outlining the high, low, and middle of price action over a given period. This indicator is useful for denoting possible buy and sell signals and spotting potential trend reversals.
The linear regression line represents the data points of interest; the upper line runs parallel to the linear regression line and is drawn above it at one to two standard deviations. The lower line runs parallel to the linear regression line and is drawn below it by one to two standard deviations.
By using standard deviation, traders also know whether the security is becoming overbought or oversold, which can signal a looming reversal.
KELTNER CHANNEL
The Keltner channel is similar to the Donchian channel as it is also an indicator of market volatility. However, its approach is different because it utilizes an exponential moving average (EMA) and the average true range (ATR) of the price action of previous trading sessions on either side of the EMA line.
This indicator is also good for identifying possible changes in the underlying trend. For example, if the price of the security closes above the upper line in a downward trending market, it could mean that the trend is about to change. Of course, you’ll need to use other indicators to confirm.
One of the best things about the Keltner channel is that it filters out superfluous information about inconsequential price action since it is based on the EMA and ATR. As such, many traders believe it provides a more accurate picture of the security’s volatility and trend direction over a given period.
Bollinger Bands vs. Price Channels
Bollinger bands are a technical indicator used to identify support and resistance levels and measure market volatility over a given period. Like price channels, they also consist of three lines drawn on the chart. The main difference is in the construction of the lines.
In price channels, you’re drawing the main trend line and the channel line. For Bollinger Bands, on the other hand, you’re using the simple moving average (SMA) as the mainline. The other lines (upper and lower bands) are calculated as two standard deviations away from the SMA.
The width of the bands is a crucial signal denoting market volatility. The wider the bands are away from the SMA line, the higher the volatility in the market. They’re also useful for identifying potential retracements (Bollinger bounce) and possible breakouts (Bollinger squeeze).
Final Thoughts
Price channel trading is one of the simplest and most effective ways to determine ideal buy and sell points on the chart. The best part is you don’t even have to draw it manually, as most trading platforms allow you to simply select it from among their list of trading indicators.
That being said, it is not a one-all, be-all tool, so be sure to utilize other technical indicators to predict market direction and confirm underlying trends before placing your buy or sell orders.