
During your trading journey, you will likely come across Smoothed Moving Average (SMMA). It’s a handy indicator tool to know because of its ability to confirm prevailing market trends that help generate buy/sell signals.
What is the Smoothed Moving Average?
The smoothed moving average is simply a moving average that assigns weight to price data points over a long period. Traders use it to gauge market trends according to a series of averages taken over a given period. As more data becomes available, they recalculate the averages to accommodate newer periods. That’s why we call it a “moving” average.
Think of the SMMA as a hybrid of its better-known siblings — the simple moving average (SMA) and the exponential moving average (EMA). The SMA looks at the price of a traded asset and divides it by the given period to be studied, but it all looks at all periods equally. Unlike the EMA, which places more emphasis on recent data.
The smoothed moving average provides a broader view of things by ‘smoothing out’ short-term market fluctuations. This added accuracy helps traders confirm market trends quicker.
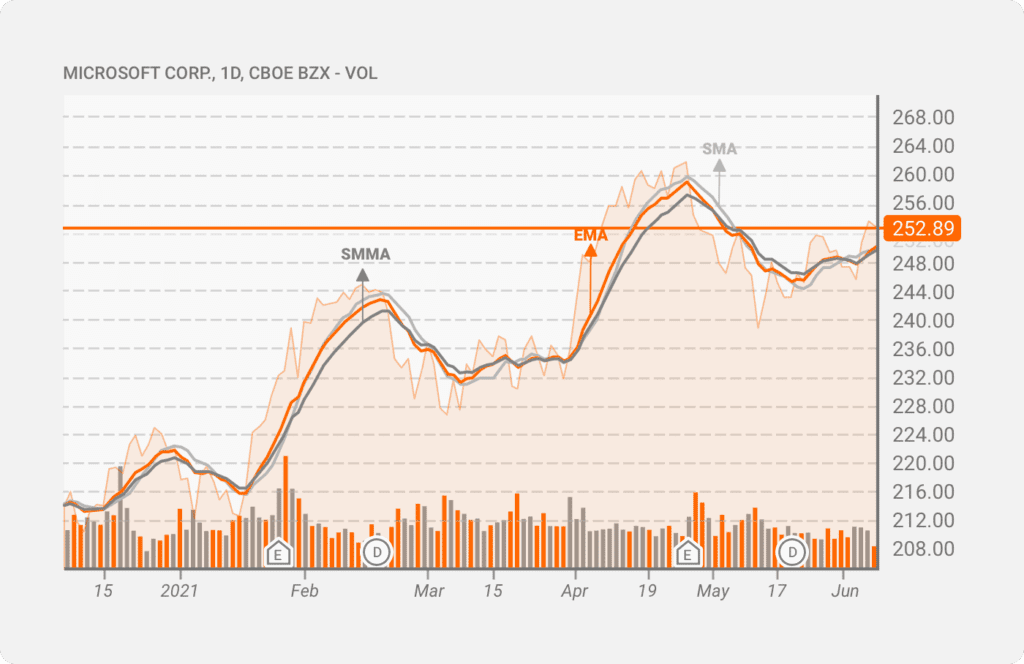
The chart below shows the Microsoft (MSFT) stock chart with the SMA (blue), EMA (red), and SMMA (green). All trendlines were plotted within the same period, and yet they show different results on the chart.
Calculating the Smoothed Moving Average
Because it is a combination of both the EMA and the SMA, the formula for calculating the smoothed moving average might come off a bit complex.
The good news is that the SMMA indicator is available by default on most trading platforms. So you don’t have to worry about the actual formula or calculation; you can just set it up on your charts with one click.
Nevertheless, let’s walk through the formula anyway. It doesn’t hurt to know how to calculate it. Plus, on the off chance that the SMMA indicator is not readily available on your trading platform, this knowledge will come in handy.
The formula for calculating the smoothed moving average is:
SMMA = (SMMA# – SMMA* + CLOSE)/N
Where
SMMA# – the smoothed sum of the previous bar
SMMA* – the previous smoothed moving average bar
CLOSE – The closing price at the time of calculation
N – the number of smoothing periods
The first period is an SMA.
By smoothing out the data over a given period, traders and analysts have a more comprehensive overview of the trend minus the deviations attributed to short-term volatility. Additionally, since it gives equal weight to data from past periods, the SMMA can represent economic conditions better than its non smoothed counterparts.


SMMA Trading Strategies
The SMMA indicator plays a vital role in many trading strategies. As a lagging indicator, it’s excellent for confirming prevailing trends, whether upward or downward, in the market. This crucial insight into market behavior helps traders identify entry/exit points.
Here are some common SMMA trading strategies:
Trend Following
The trader buys an asset whose price is already on the rise and confirmed to be trending upwards in trend following. They also short the asset when the price is already falling and confirmed to be trending downwards.
The beauty of this trading strategy lies in its simplicity. It’s only common sense to buy an asset when you’re confident that the price will go up, giving you a nice profit. The smoothed moving average line serves as a guide for identifying when to buy or sell based on the current market trend.
For instance, the SMMA line will usually remain slightly above it when the asset price trends downward. Once the trend is about to end, the price and SMMA lines will start to draw closer to each other, signaling that a trend change is imminent.
Trend following with the smoothed moving average indicator works across every traded asset class.
Reversals
Identifying potential reversals in price action is a massive opportunity to enter or exit a position. A reversal is when the current trend comes to an end, and a new one begins in the opposite direction.
For example, if you spot a bullish reversal about to start in a down-trending market, you take a long position and wait for the reversal to occur so you can ride the resulting price rise to accumulate profits.
One of the most effective ways to use the SMMA in trading reversals is when used with another moving average line measured over a different period. The idea is to be on the lookout for crossover between both trendlines.
If the crossover occurs after a strong upward trend, a new bearish trend is likely gathering momentum. On the flip side, if the crossover occurs after a definite downward trend, it signals a possible bullish trend on the horizon.
The 50-day and 200-day SMMA indicators are the most common periods in use here. These are also known as the golden cross and death crosses. It’s a golden cross when the two SMMA lines make a bullish crossover. And it’s a death cross when the lines form a bearish crossover.
Current Price Concept
In this trading approach, you’re looking at the current price and comparing it to the SMMA indicator line. If you’re just starting your trading day and are looking for great entry points, this strategy can help you make an informed choice.
If the asset’s current price is trending above the SMMA line, it’s a signal to buy. When it goes down below the SMMA line, you exit the position. The reverse is the case when in a short position. You sell when the current price goes below the SMMA line and exit the position when it rises above it.
Setting Up the SMMA on Your Trading Chart
Simply find the SMMA indicator among the list of built-in indicators and strategies on your trading platform. Click on it, and the moving average line will appear on the chart. You can then edit its parameters based on your analytical preferences.
Like all types of moving averages, it’s up to you to decide the period for which to analyze. There is no standard recommended period.
That being said, most short-term traders typically calculate averages over 14 and 28 day periods. Long-term traders tend to favor the 50, 100, and 200-day periods when plotting SMMA.
Smoothed Moving Average vs. Other Moving Averages
As you use smoothed moving averages for trading, it’s important not to confuse it with other types of moving averages. Though they all tend to follow similar trend directions, the kind of data they reveal can be pretty different from one another. The primary reasons are the differences between the weighting factor and the length of the average we’re analyzing.
To understand these variances better, let’s compare the SMMA to the SMA and EMA.
SMMA vs. Simple Moving Average
The most significant difference between an SMMA and an SMA is the time frame involved when calculating the moving average. An SMA generally uses a shorter period when generating the average.
One of the most significant drawbacks of this approach is that with a short-term trendline comes the possibility for false signals. A long-term trendline can provide a stronger signal, but there will be a lag.
Traders have to wait until the price action is confirmed before making their moves in the market. In so doing, they might miss out on some prime trading opportunities when the trend began. The SMMA helps avoid this issue by covering an extended period, thereby removing short-term fluctuations. And because it is smoothed out, traders can easily view the trend.
SMMA vs. Exponential Moving Average
The EMA is an advanced form of the SMA and can help traders confirm the prevailing market trend much faster. The underlying reason is that the EMA places more weight on recent data, making it more sensitive to changes in price movements.
However, this sensitivity to recent volatility is also its main drawback. For example, if the market experiences a sudden spike, the EMA line will reflect that change. Suppose the trader is not using another indicator to confirm the trend and the strength behind it. In that case, they could take action based on the false signal generated by the short-term volatility.
The smooth moving average helps prevent this because it also considers past data in generating the average instead of emphasizing more on recent data. It enables a more accurate and relevant average that is not easily swayed by short-term volatility.
So at the very least, consider using both the EMA and SMMA when making trading decisions.
Final Thoughts
Becoming a successful trader requires you to understand how to utilize technical indicators. Whether you’re just starting out or you’ve been in the game for a while, the smoothed moving average is a tool that should be in your trading arsenal.
For all its benefits, however, keep in mind that the SMMA only works well under certain conditions in the market. These are upward and downward trends. If the price is trending sideways, the SMMA can’t provide a lot of valuable data. That’s why it’s important to mix it up and not stick to only one tool. Some technical indicators that work well with the SMMA include Bollinger Bands, Price Channels, and Stochastic Oscillator, to mention a few.


Nice Info
Glad it was helpful!