Last Updated on May 9, 2024
There is a variety of factors that traders take into consideration when buying and selling futures contracts. Depending on their style, some rely on analyzing graphs and finding stock chart patterns, while others look at fundamental factors like anticipated earnings, seasonality, commodity production costs, etc. Technical and fundamental analysis often go hand-to-hand in the strategies of successful futures traders. Some build pricing models and validate them by looking at charts. Others prefer to review charts first and then validate their ideas by looking at the asset’s fundamentals to see whether they should expect a price move, the continuation, or the establishment of a new trend.
In this guide, we will focus on the technical side of things. Choosing the right technical analysis tools is essential for building a sustainable and efficient futures trading strategy. They can help the trader set the stage for his prediction about the direction in which the market will move next.
To help you become a better trader, in the next few lines, we will dive into some of the most popular chart patterns seasoned experts use to select trades, predict upcoming market shifts, and time their entries and exits.
What are Stock Chart Patterns in Futures Trading?
The patterns that futures instruments’ price forms usually visualize the transitions between upward and downward market trends or their continuation. Technical analysts typically analyze charts to find patterns created by the price movements of the instrument and try to determine the market’s direction. To do that, they often focus on analyzing the supply and demand support and resistance levels to help spot patterns that can break or continue them.
When it comes to futures trading, aside from knowing their shape and recognizing them on the chart, there are some other vital things that you should bear in mind.
First of all, is the existence of a prior stable and well-established trend that sets the stage for the upcoming reversal one. If the price hasn’t formed a trend and instead it’s constantly bouncing up and down, a reversal trend can’t be formed.
It is also worth noting that usually, top patterns are shorter and more volatile than the bottom ones. The price swings there are much bigger, which is why many traders perform better in a downtrend.
And last but not least, don’t forget to remember the basic rule of thumb:
The longer the pattern develops and the more volatile the price movement within is, the bigger price change you should expect once it breaks the support/resistance.”
We can best categorize chart patterns according to the signals they give. Usually, there are two types of patterns in futures trading, but some experts argue there is a third one. Now, let’s go through their different types and find out more about their characteristics:

You might also enjoy:
- 5 Things To Know About Trading E-Mini Russell 2000 Futures
- 5 Differences Between The S&P 500 E-Mini & The Micro E-Mini Futures
Continuation chart patterns
Traders use continuation patterns to identify situations where the established trend will continue its direction. Think of continuation patterns as pauses in the general trend. This type is also known as a consolidation (sideways market) pattern. In reality, the continuation patterns can’t tell on which side we should expect a breakout.
Examples of continuation patterns are Flag and Pennant patterns, wedges, symmetrical triangles, ascending and descending triangles, etc.
Reversal chart patterns
Reversal patterns are the opposite of the continuation ones. As their name suggests, they indicate a shift in the prevailing trend direction, and the price starts moving the opposite way. For example, if the reversal pattern appears during a market downtrend, the trader should expect it to change its course and enter an upward movement.
The change in the trend’s direction doesn’t happen instantaneously, though. First of all, there is a short pause, which indicates the “fatigue” of the bulls/bears. During the slowdown, the other group starts prevailing, and the trend is changed.
Good examples of these patterns are head and shoulders, double and triple tops and bottoms, and others.
Bilateral chart patterns
Some experts prefer to divide the stock chart patterns further by adding an additional category. You may often hear traders refer to some patterns as “bilateral.” Bilateral patterns reveal that the price can move in either direction. It’s not always obvious how such a pattern group can be helpful. Typically the traders who use bilateral patterns want to have a safety net and place an order on the top and the bottom of the pattern. Once one of the orders is triggered, the other is canceled.
Think of bilateral patterns as an indication that the market is highly volatile.
The triangle formations are often considered a part of this group. Once we go through them in detail, you will find out why we describe them as both a continuation pattern and bilateral at the same time. The main idea is that triangle patterns can’t tell where the breakout will be.
Let’s now get more practical and dive in the…

Top 10 stock chart patterns to look for when trading futures
When trading futures contracts, you are likely to come across a variety of stock chart patterns. Some are easier to spot, while others are quite complicated and often tricky. However, if you are just starting with trading and technical analysis, we recommend trading with the most popular and time-tested patterns.
Here is a pick of the top 10 stock chart patterns you should look for when trading futures:
1. Ascending and Descending Triangles
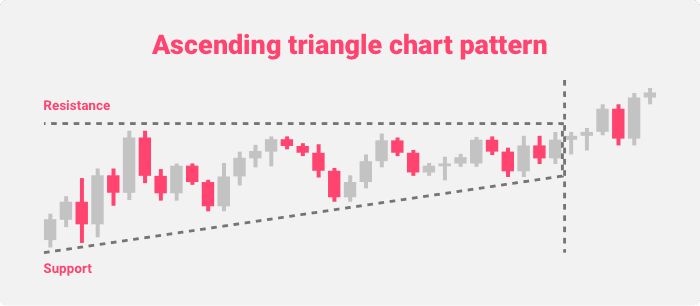
The Ascending Triangle chart pattern is one of the popular bullish futures patterns that can help you recognize the breakout of an upward market movement. The pattern forms when the resistance level remains flat and the support level rises. If you notice the pattern from the chart below, you should expect that the price will go up and down within the triangle’s boundaries until the resistance and the support levels converge. Once they come together, a breakout should follow, and an upward market movement should form.
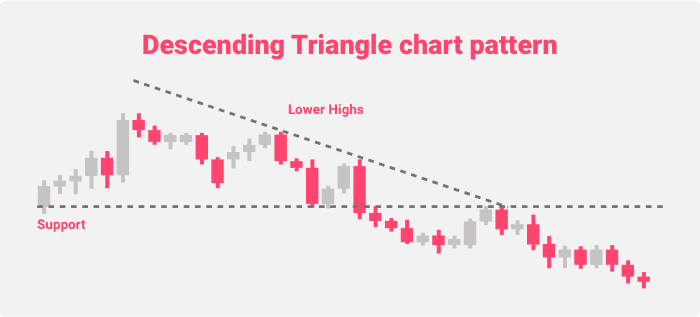
You should also look for the reverse pattern, the Descending Triangle. As its name suggests, it paints a bearish price movement that marks the start of a continuous downtrend market. The Descending Triangle chart pattern is formed when the resistance drops and the support levels remain flat.
When you spot a Descending Triangle pattern, you should know that the futures price will go up and down within the figure until the support and resistance levels merge. Once this happens, a breakout follows, and a downtrend movement forms. The practice shows that the Descending Triangle pattern isn’t as common as the Ascending Triangle.
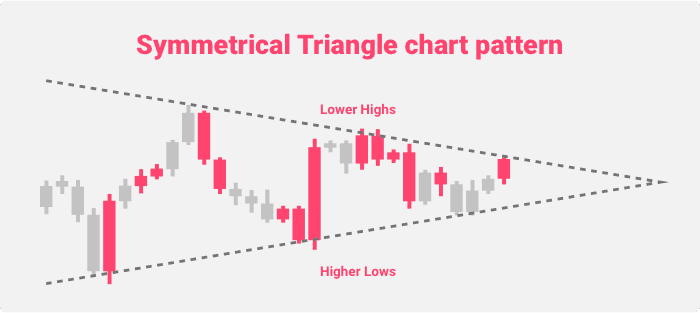
Another widely popular triangle chart pattern is the Symmetrical Triangle. The pattern indicates the continuation of the previous trend and can be seen when it consolidates. This type of triangle pattern is called symmetrical because it is formed when the resistance line goes down while the support line goes up. Once a triangle is formed, the price of the futures will bounce up and down within the figure until both trend lines converge. Next follows a breakout point, which should continue the direction of the trend. In some cases, though, the direction may change.
2. Cup and Handle
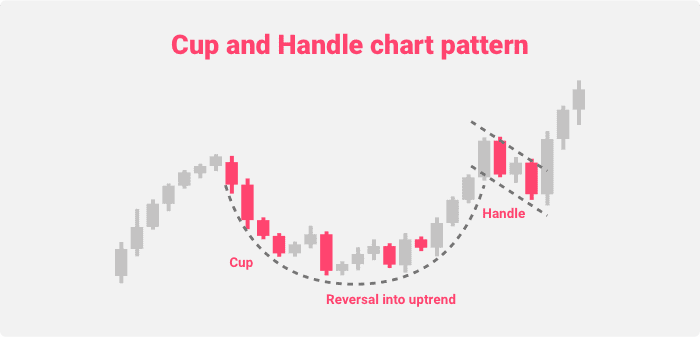
The Cup and Handle is another positive stock chart pattern that shows the continuation of the bullish market movement. It is helpful because it usually marks a pause in the upward trend and a period of bearish sentiment, right before the bullish movement continues. Many traders may mistake this slow-down as a trend-reversing event, while it is just a temporary pause in the upward movement.
The pattern can be easily recognized as it resembles a cup with a handle (the cup visualizes the trend movement, while the Handle marks the pause in the trend). However, the market shows plenty of identical price movements daily, which may often confuse traders. To make sure you have recognized that a real Cup and Handle chart pattern is formed, make sure to look for the following key moments:
- First, there is an upward trend
- The trend reaches a plateau, which is followed by a sell-off
- The sell-off then stalls and the movement remains flat
- New buyers join, and the price nears the resistance levels (the initial ones, where the upward trend stopped)
- A small downturn follows, which marks the handle
- The trend continues its upward movement by breaking the resistance levels
What is interesting about the Cup and Handle pattern is the way it tests the resistance levels. The point where the pattern proves to be particularly valuable is the forming of the Handle. Look for it as the Handle should usually account for approximately 30% – 35% of the whole movement.
3. Diamond Top and Bottom Patterns
The Diamond Top pattern indicates a bearish reversal that can trigger a downtrend market movement. It forms when the price trend’s widening is closely followed by a narrowing. To spot a Diamond Top pattern, you should, first of all, spot an off-center Head and Shoulders pattern. Once you do this, you should draw the support and resistance lines. The shape that forms when you connect everything resembles a diamond.
The pattern helps indicate the moment when you can short the asset to avoid entering a bullish trend.
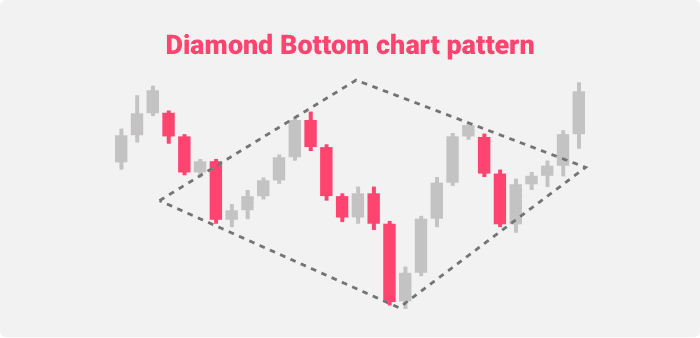
The Diamond Bottom stock chart pattern, on the other hand, indicates the potential beginning of an upward market movement and the reversal of the bearish trend. You can spot it when the price trend starts widening and then narrows. To identify the Diamond Bottom pattern, you should go through similar steps – find an off-center head and shoulders pattern and draw the support and resistance lines. If you spot a Diamond Bottom pattern, you can go long.
4. Double Bottom and Double Top Patterns
The Double Bottom futures trading pattern occurs at the peak of a downtrend market movement and usually indicates the start of a bullish trend. Often, traders find it hard to recognize Double Bottom patterns, so it is essential to know the mechanics behind their formation. Here are the four steps:
- The asset’s price hits a new low
- It fails to break the support and hits a new high (forming a new resistance)
- The price bounces from it and started falling towards the support level just to rise again
- The price breaks the resistance and starts an upward trend
It is also worth noting that once an upward trend is established, you should keep an eye on it as there is a chance of dropping back to test the new level of support (formed in the breakout point).
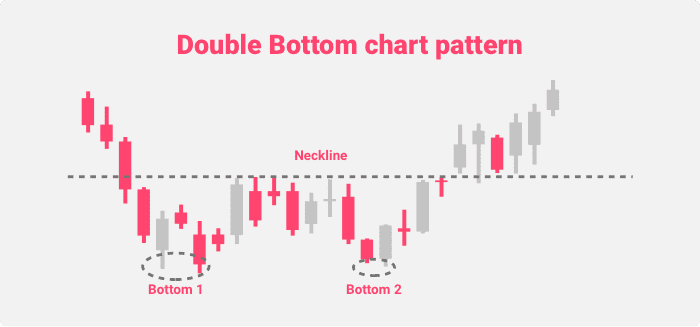
The pattern usually indicates that there is a constant bidding war between buyers and sellers. In the end, the buyers take the upper hand.
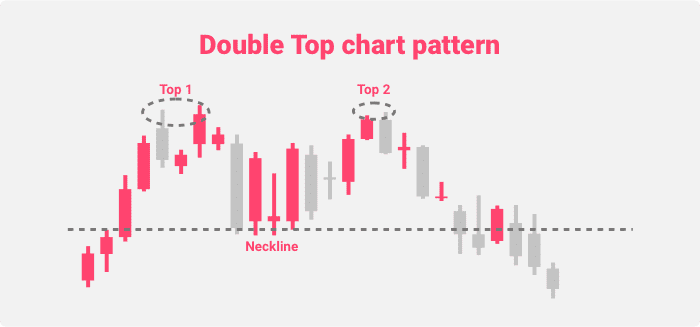
The Double Top stock chart pattern, on the other hand, marks the peak of a bullish trend and can indicate the start of a bearish one. This reversal pattern occurs when the following four characteristics are present:
- The price hits a new high
- It bounces back from the resistance and heads towards support
- a series of sell-offs, the price starts bouncing between resistance and support
- The price breaks the support level and sets a bearish trend.
Such a pattern also indicates a constant bidding war between buyers and sellers, with the latter dominating. If you spot a Double Top chart pattern, make sure to look for trading volume as well. Often, the volume jumps once the price level falls below the support.
The Double Top futures chart trading pattern is often mistaken with the Big M pattern. The difference is that the latter forms much more aggressive movements and steeper figures.
5. Triple Bottom and Triple Top Patterns
The Triple Top and Triple Bottom stock chart patterns are bullish and bearish reversal patterns that indicate when the support and resistance levels are tested three times before the price bounces back above either one. This pattern paints a situation of a trading war between the bears and the bulls on the market. In the case of the Bottom pattern, the sellers back off, and the buyers’ interest pushes the trend upward. In the case of the Top pattern, the sellers overcome the buyers’ intentions, which forms a downtrend movement.
Let’s start with the Triple Bottom pattern. This bullish reversal pattern occurs when the futures instrument’s price tests the support levels three times and jumps above the resistance. To be sure that you are witnessing a Triple Bottom pattern, make sure that the following key points are in line:
- The price reaches a new high
- The trend fails to break the support and gets back to the resistance level
- It starts moving back to the support, just to fail again and rise to the resistance level
- The price bounces of the resistance level and starts moving toward the support line
- The trend is reversed due to the buying interest, breaks the resistance level and forms a bearish trend
Make sure to keep an eye on the bearish trend as there is the risk of it getting back to test the newly-formed support level.
The Triple Top pattern, on the other hand, reverses a bearish trend and occurs when the trend tests the resistance three times unsuccessfully and then falls below the support line. The pattern can be recognized in similar circumstances like the Triple Bottom – the price reaches a new low, bounces between the trend lines three times until it finally breaks the support, and sets a bearish trend. When you spot a Triple Top pattern, it is essential to keep an eye on the trading volume as it should increase once the price breaks the level of support (which may later turn into resistance).
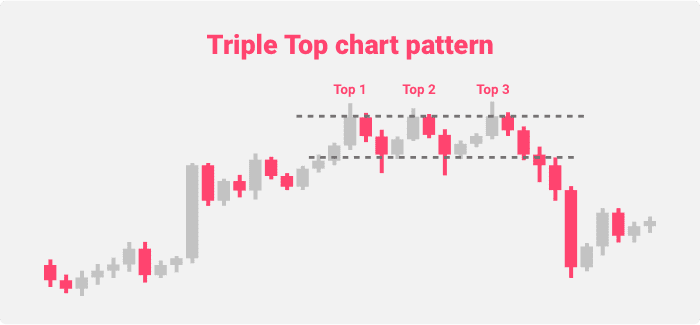
You may wonder how this pattern is any different from the Double one. In reality, they are very similar. However, with the Triple Top and Bottom chart pattern, the trader should carefully observe when the trend breaks the support or the resistance levels. At that point, the pattern is fully completed. Otherwise, the price may continue bouncing up and down before both lines and distort the trader’s perception of the upcoming price movements.
6. Falling and Rising Wedge Patterns
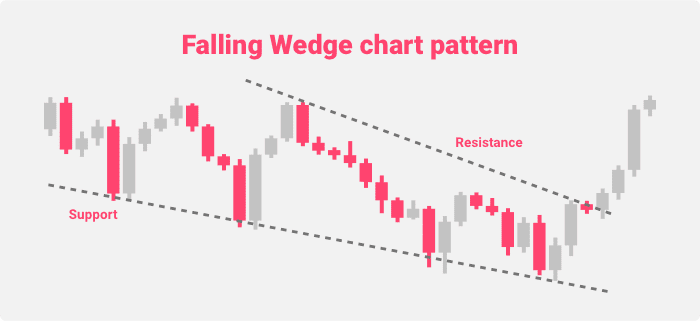
Next on the list comes the Wedge pattern. It has two variations – a falling and a rising one. Let’s start with the Falling Wedge futures chart trading pattern. This bullish reversal pattern indicates the end of a downtrend movement in a bullish market. The mechanics behind such a trend are based on the fact that once the price starts moving down, the distance between the highs and the lows gets narrower. This leads to the convergence of the support and the resistance levels, which sends the price back in its upward movement. To avoid mistaking the Falling Wedge pattern with another technical indicator, make sure to keep an eye on the trading volume. In such scenarios, the trading volume should always be increasing.
The Rising Wedge pattern, on the other hand, is a bearish reversal pattern that marks the end of an upward price movement in a bearish market. To recognize it, you should look at the distance between the highs and the lows, which should be getting smaller in the case of the Rising Wedge pattern. The pattern continues until there is a convergence between the support and the resistance levels. After the pattern is completed, a downturn movement follows.
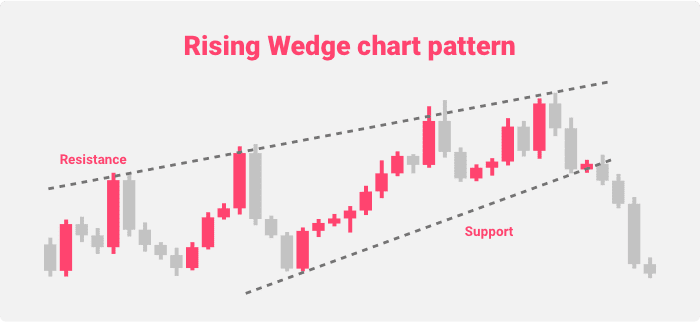
The thing with the Rising Wedge pattern is that it may often be too hard to recognize for some traders. To ensure that a trend reversal occurs, it is essential to keep an eye on the trading volume and whether it is decreasing. Another thing that should be in line for a Rising Wedge pattern to occur is a retrace below 50% of the Fibonacci level.
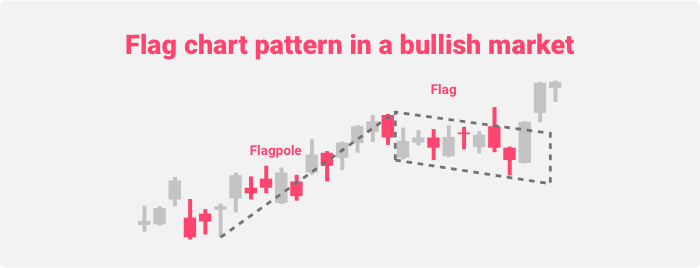
7. Flag Chart pattern
One of the most popular futures chart trading patterns is the Flag. It is a continuation pattern that resembles a parallelogram. We can usually find Flag patterns within intra-day timeframes. They mark short-term consolidations that confirm the strong trends within the longer timeframe. Traders look for Flag patterns in futures charts to plot re-entry opportunities during a trending market movement.
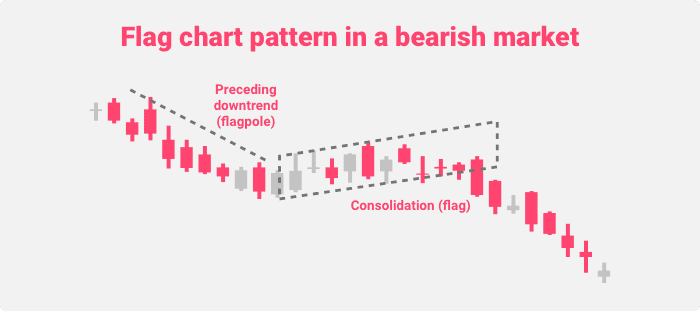
The figure tends to form by the trend lines that mark the support and resistance levels. We can typically observe Flag patterns after a significant price movement and indicate the slowdown of the market. However, right after the Flag ends, the market usually gets back to the general trend.
Bear in mind that a Flag pattern can appear in both a bearish and a bullish market. You should look at the moment when the price breaks out (when the pattern is completed). Bear in mind that the Flag chart trading pattern usually faces the opposite direction of the initial price movement.
8. Head and Shoulders – Bottom and Top Patterns
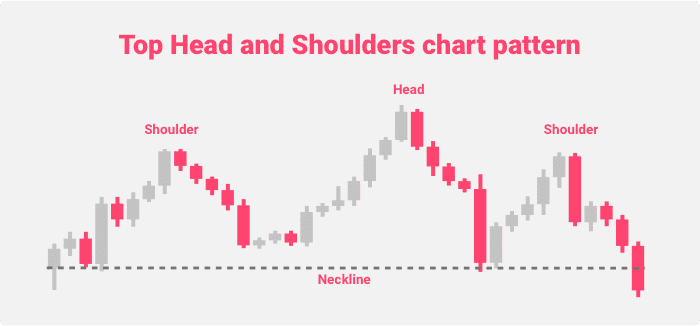
The Head and Shoulders pattern is one of the most popular and widely applied by futures traders. Head and Shoulders are also one of the easiest to spot market patterns when analyzing charts due to their precise shape. This reversal pattern is handy since as it indicates a change in the current trend.
What is important when trading on signals from both types of Head and Shoulders patterns is always to keep an eye on the trading volume as it may cause some confusion if there is excessive trading.
The Bottom variation of the indicator is a reversal pattern that helps mark the point when the asset will change the direction of its movement and start heading against the previous trend.
The Bottom Head and Shoulders pattern consists of two smaller side peaks and one bigger middle peak. The pattern starts forming once the instrument’s price hits a new low and then bounces back to form a new high. Next comes an even lower bottom that sends the price back to hit the previous high. The pattern continues with the price falling down but not as low as the bottom, continuing upward. Once it breaks the high, the pattern is completed.
Traders use the Bottom Head and Shoulders pattern to mark the start of a new upward trend. However, it is worth noting that high-volume market moves can usually disturb the pattern by forming breakout points. So, don’t forget to keep an eye on the volume as well.
The Top Head and Shoulders pattern, on the other hand, indicates the moment when the traded instrument is heading for a downtrend movement. The top pattern also has three peaks (one bigger in the middle and two smaller on the sides). The mechanics are the same – first, there is a new high, and later, the price hits a new low. The instrument then bounces to an even higher high level, just to fall to the previous low. The price continues to go up, but not above the level of the head, and then falls once again. When the price breaks the previous low, the pattern is completed.
9. Pennant Chart Pattern
The Pennant chart pattern indicates a situation where the support and the resistance lines consolidate. The continuation pattern often marks a temporary market slowdown, following a notable price movement. After the slowdown, the trend resumes. It is worth noting that, in the case of the Pennant indicator, the support and resistance trend lines aren’t tested multiple times. A buy or sell signal usually forms when the price breaks the trend lines in case there is enough volume.
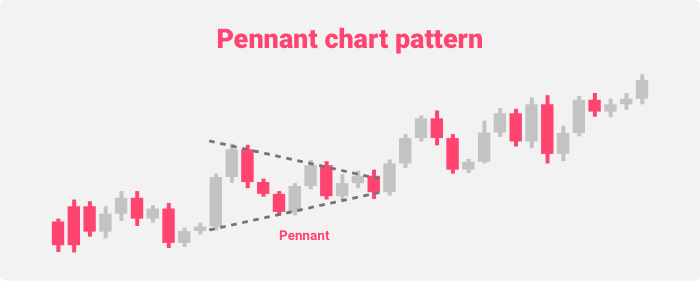
A crucial thing to remember about the Pennant stock chart pattern is that it always follows a sharp market movement and marks a sideways price direction. It is worth remembering that, although we consider the Pennants a continuation pattern, it can often resemble a reversal and confuse traders. That is why it is important to always wait for confirmation and the completion of the pattern. Make sure to avoid acting rashly and never jump on early signals.
To make sure you can easily distinguish the Pennant from the Wedge signal, bear in mind that Pennants are always horizontal and wider. In contrast, Wedges are either ascending or descending and always narrower.
Pennants are also almost identical to Flags. To distinguish both patterns, remember their only difference – the Pennants’ consolidation phase has converging trend lines, while one of the Flag patterns has parallel trend lines.
10. Top and Bottom Rectangle Patterns
Traders use the Rectangle pattern to time a consolidation point right before a price breakout takes place.
The Bottom Rectangle pattern starts on a downtrend movement. It forms when the price bounces between parallel support and resistance trend lines. What is typical for the bottom pattern is that it is capable of breaking in both directions. Once it breaks a certain line, a new trend is formed that continues the established course.
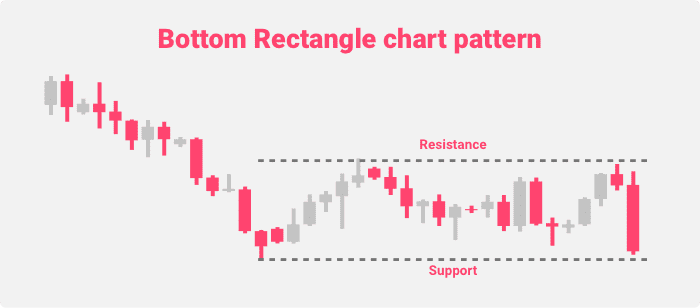
When you spot a Bottom Rectangle pattern, ensure your successful trading performance by making sure to sell when on a breakout below the support line or on pull-backs to the support line (acting as resistance) right after the breakout.
The same things are valid for the Top Rectangle chart pattern, as well. The only difference is that it forms in periods of bullish market trends.
To trade the Top Rectangle pattern in successfully, make sure to buy when on breakouts above the resistance and on pull-backs to the resistance (acting as support) after the breakout.
Conclusion on Stock Chart Patterns
Since trading history often repeats itself, technical analysts have designed advanced pattern recognition trading techniques, which have helped significantly increase futures trading success. However, it is worth bearing in mind that none of the stock chart patterns are flawless. There is no guarantee that they will work all the time, which is why technical analysis in futures trading requires so much attention to detail. The pattern can be distorted if you just miss a few candles, which will undoubtedly influence the accuracy of your entry and exit timing. Make sure to double-check whether a certain pattern is really there and combine them with other indicators.
References
KRISTOPHER, Gordon. Why the triple top and triple bottom patterns are important. MarketRealist, 2014. Available at: MarketRealist. Referenced on: March 24, 2020.
VENKETAS, Warren. Using Rectangle Patterns to Trade Breakouts. DailyFX, 2019. Available at: DailyFX. Referenced on: March 24, 2020.
10 chart patterns every trader needs to know. IG, 2018. Available at: IG.com. Referenced on: March 24, 2020.