Last Updated on November 21, 2022
Candlestick patterns (also known as “Japanese candlestick charts”) are the indicators that form the basis of technical analysis as we know it today. They were first developed by Munehisa Homma in the 1700s in Japan. Today, Japanese candlestick patterns are an invaluable part of modern traders’ set of tools. They are used to describe price movements of a particular liquid security, currency, or derivative instrument like futures or options. This in-depth guide will help you get familiar with bullish and bearish candlestick patterns and learn how to use them in your daily trading activities.
Introduction to Candlestick Patterns
Candlestick patterns are technical trading formations that help visualize the price movement of a liquid asset (stocks, FX, futures, etc.). They are used by traders to time their entry and exit points better.
By default, candlestick charts show one-day intervals. This means if you are observing a one-month chart, you will likely see 20 candlestick patterns. Japanese candlestick charts, however, can also represent intervals longer or shorter than one day.
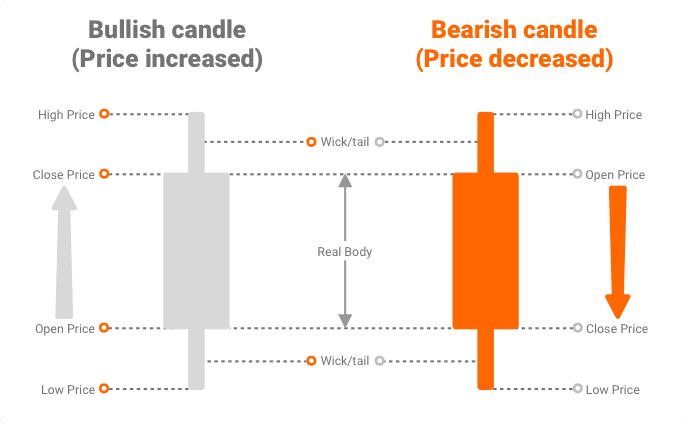
A single candlestick pattern is constructed of four different components representing important pieces of pricing information for the trading day – open, close, high, and low. The first two, open and close prices, are represented by the thick body of the candlestick. The candle wick and its tail indicate the high and low price points that have been recorded throughout the day. Due to being densely packed with valuable information, Japanese candlestick patterns have become one of the most preferred trading tools.
The story of candlestick patterns’ origin is so popular that over the years, it started evolving, and today, it is hard to divide fiction from reality. Some sources suggest candlestick patterns were developed in 1750 by a Japanese businessman from Sakata, named Munehisa Homma, who was trading rice at the local exchange. Others, including Steve Nison, say that it was unlikely Munehisa Homma was using candle charts at the time. What is known for sure is that candlestick charts were invented in Japan in the period 1750 – 1800.
Candlestick patterns were brought to the Western world by Steve Nison in 1989. His two books, “Beyond Candlesticks: New Japanese Charting Techniques Revealed” (where he made the claim that it was unlikely for Homma to have used candlesticks) and “Strategies for Profiting with Japanese Candlestick Charts are considered a must-read resource for any trader”.
You might also enjoy:
- Relative Strength Index (RSI) – What is it and how to calculate it?
- Fundamental Analysis – A Complete Guide from Basic to Advanced

How to Read Candlestick Patterns?
There are three essential things to bear in mind if you want to understand how to read candlestick patterns. The first is related to the wide part of the candlestick, known as the “real body”. It tells investors whether the closing price for the observed period was lower or higher than the opening one. The next thing to look for is the candlestick shadow, which helps track the daily high and low prices and how they compare to the open and close prices. Here is how to read candlestick patterns when you see them on the chart:
Real Body
If the real body of the Japanese candlestick pattern is visualized in red, the stock has closed lower than the opening price (bearish). If, on the other hand, the body is painted in green, then the stock has closed at a level that is higher than the opening price (bullish).
In the example above, the candlesticks are presented in green and red. Depending on the trader’s preference, though, the candlesticks can be painted in black or white as well. Bullish candlesticks are presented in white color (or empty inside), while the bearish candlestick patterns are visualized using black (or filled in).
Candlestick Shadow (Wick & Tail)
Candlestick patterns usually vary in their shape. Some have longer tails and shorter wicks, while others have longer wicks and shorter tails. There are also candlesticks with shadows that are pretty identical on both sides. How a candlestick pattern looks depends on the relationship between its high, low, opening, and closing price.
For example, if the wick (upper shadow) of the candlestick is short, then the opening price was close to the high price for the day. If this scenario is observed on a bullish day, then the closing price for the particular period was close to the high one. And vice-versa.
When looking at the Japanese candlestick patterns, one should analyze them in the context of the whole market, rather than individually.
Bullish Candlestick Patterns
Bullish candlestick patterns are formations that mark the presence of a market momentum dominated by buyers. There are dozens of different bullish candlestick patterns. However, not all of them are equally popular.
To narrow the field, we will focus on the five most widely-spread bullish candlestick patterns and will find out how to spot them on a chart, as well as the best way to trade them.
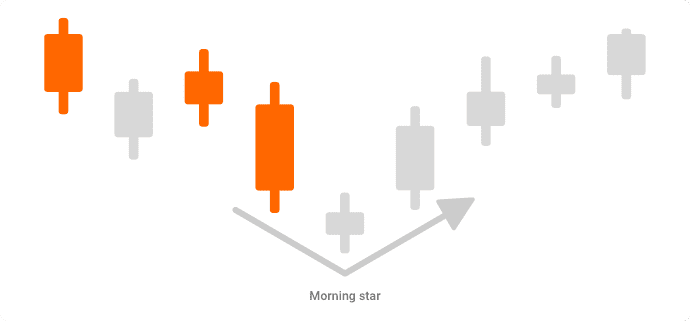
Morning Star
The Morning Star is a popular bullish reversal candlestick pattern constructed by three separate candles. The first is a long-bodied black/red candle, followed by a short-bodied one (also known as Doji). The pattern is closed by a long white/green candle. The Doji’s body color can be either white/green or black/red. However, its body doesn’t overlap with the one of the preceding candle.
Traders love the pattern as it brings them hope in gloomy markets. The Morning Star indicates that selling pressure is calming down. The last candle in the pattern reveals the renewed buying interest and usually sets the beginning of a bullish reversal trend. To get a better confirmation about this, make sure to look at the trading volume (it should be higher).
Bullish Engulfing
Bullish engulfing candlestick formations indicate that the buying interest in the particular asset is exceeding the selling one. This reversal pattern is formed by two candles. The first one is bearish, while the second is the bullish one. The bullish (the white/green candle) covers the bearish one (the black/red candle) completely. The pattern is called that way as the second candle “engulfs” entirely the real body of the first candle.
To make sure that you are really looking at a bullish engulfing pattern, focus on the second day (candle). It should open lower than the previous low, but due to the bullish pressure, it marks a higher high.
Bullish engulfing patterns can be seen in downtrend market movements. They usually indicate that the bulls are strong enough to drive the price of the asset upwards. You can open a long position when the price of the asset goes higher than the high of the second candle (or when there is a confirmation of the downtrend reversal).

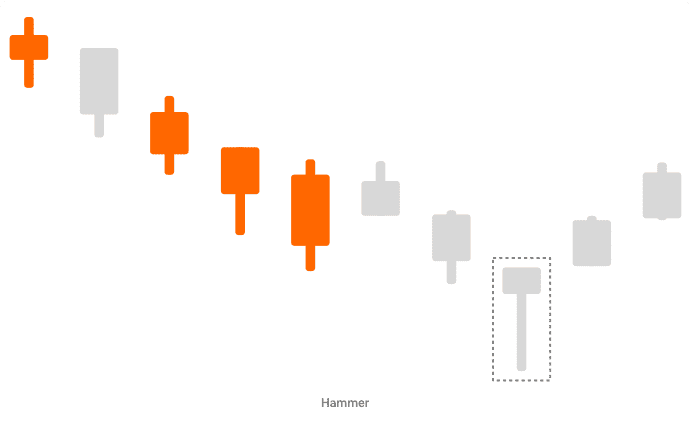
Hammer and Inverted Hammer
The Hammer is basically a one-candle pattern found at the end of a downtrend movement. This bullish reversal pattern indicates that the observed instrument is soon to embrace an upward movement under the dominance of bulls’ presence in the market. The specific hammer-like shape of the candle makes it easy-to-recognize among the other patterns as it has a longer tail (usually the lower shadow should be at least twice the length of the body). This indicates that bears are driving the prices down during the particular trading day. When a hammer pattern is present, however, the low prices are followed by significant buying pressure, which leads to higher closing prices.
Traders who open positions solely by looking for Hammer candlesticks often end up disappointed, though. It is crucial to confirm the pattern with an increase in the trading volume. Open long positions only when such is present and after observing the market a few days after you notice the Hammer, to validate that a bullish trend is actually forming (just like the case of the example below, where two days have already passed after the Hammer was spotted).
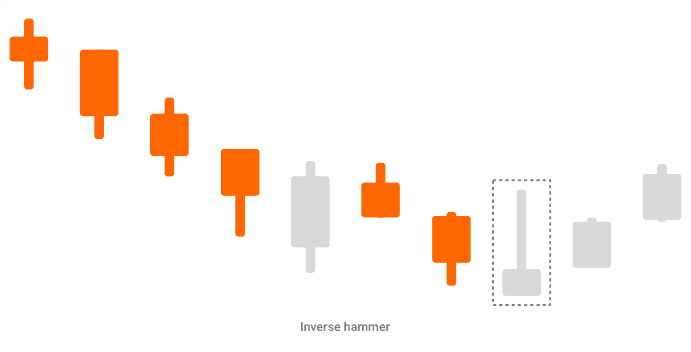
The Hammer also has an inverted version, which also forms in a downtrend and marks price support or a potential trend reversal. The main difference between both candlesticks is in the fact that the Inverted Hammer has a longer wick (upper shadow). It marks the increased buying pressure after the opening price, immediately followed by selling pressure, which, however, hadn’t been enough to drive the price lower than its opening.
Similar to the traditional Hammer indicator, here it is also important to wait for the bullish trend to be confirmed, before opening a long position.
Bullish Harami
The Bullish Harami is a trend reversal pattern that takes place when the market is heading down. It can be spotted when a white/green small-bodied candlestick appears after a series of bearish (black/red) candlesticks. Aside from that, the bullish Harami candlestick should be contained within the body of the previous day’s candlestick.
If you notice this on the chart, you should know that the trend is losing pace. However, don’t jump in right away. Wait to see if the Harami candlestick is followed by another up day. If this is the case, expect other bearish days to be on the way.
The indicator is called that way because “harami” in Japanese means “pregnant”. According to the technicians, the combination of a longer-body bearish candlestick and a shorter-body bullish candlestick resembles a pregnant woman. Although it requires a bit of imagination, the example below visualizes the logic behind the name of this bearish candlestick pattern.

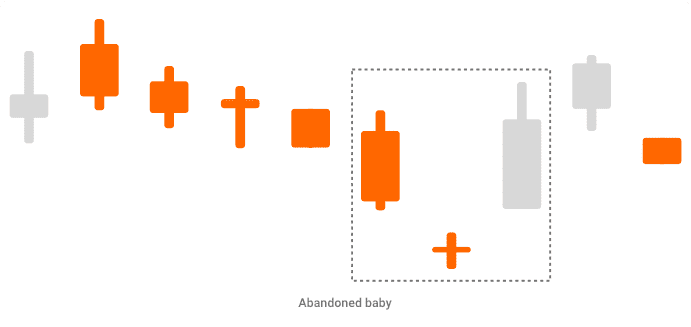
Abandoned Baby
This is another bullish reversal pattern that occurs at the lowest points of a downtrend. It is widely popular and considered by many technical traders as a significantly accurate indicator that can be used even on its own. The Abandoned Baby indicator consists of three candles – two big-bodied (one bearish and one bullish) and one small-bodied sandwiched between them (which is the “abandoned baby”).
To be sure that what you see actually is the Abandoned Baby candlestick, make sure to look for a series of bearish (black/red) candles continuously marking lower lows. The baby, which is a Doji candlestick, appears right after them due to a lack of selling interest. It is followed by a bullish (white/green) candlestick that marks the trend reversal and the potential of higher highs in the next trading sessions. The Doji usually is quite distanced by “its parents”, the surrounding bearish and bullish candlesticks.
According to some traders and technicians, including Thomas N. Bulkowski (in his book “Encyclopedia of Candlestick Charts“), the Abandoned Baby candlestick pattern can be trusted to accurately predict higher upcoming prices in 70% of the cases.
“In reality, you would not be able to trade every pattern in live markets because there would be too many of them.”
― Llewelyn James, “The Honest Guide to Candlestick Patterns: Specific Trading Strategies. Back-Tested for Proven Results”
Bearish Candlestick Patterns
Bearish candlestick patterns indicate when the market is dominated by participants with selling sentiments. Technical traders rely on a universe of bearish candlestick patterns. The goal of this guide, however, isn’t to cover all of them but to focus on the most popular ones which beginners and professionals use most often. If you are willing to find out more about the most popular candlestick patterns, check some of the leading books on the matter like “Candlestick Charting Explained” by Gregory L. Morris.
Now, let’s focus on the top 5 most popular bearish candlestick patterns and find out how to spot them on the graph:
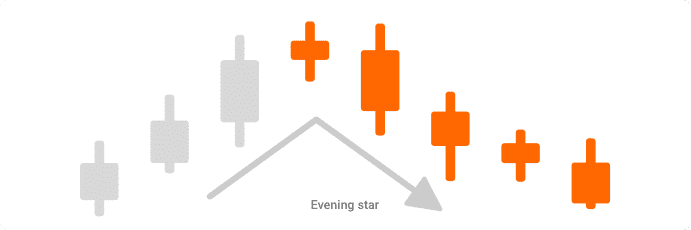
Evening Star
The Evening Star is a reversal candlestick pattern that indicates when a bearish trend is about to take place. It usually consists of three different candles – a big bullish (green/white) candlestick, followed by a small-bodied bullish, and a bigger bearish (red/black) ones.
The small-bodied candle in the middle indicates the moment when the buyers’ interest is starting to wear off, and when the bears are about to take over. The third candle in the pattern usually opens at prices lower than those of the previous day and closes at levels near the middle of the first day.
The Evening Star candlestick pattern marks the top of an uptrend and the slow-down in buyers’ interest. Once the pattern is completed, traders can open short positions. The interesting thing about the Evening Star pattern is that it is relatively rare. When it occurs, however, traders are often encouraged to act as it is a highly reliable and powerful indicator of future price declines.
The Evening Star is the opposite of the bullish Morning Star candlestick pattern that we covered already.
Shooting Star
This bearish indicator has a long wick (upper shadow) and lacks or has a very small tail (lower shadow). Its body also is small and is usually placed near the day’s low price. The Shooting Star candlestick follows market uptrends and marks their tops, which usually is also a sign for a downside trend reversal.
An important sign to look for is the distance between the opening and the high price for the day. It should be at least twice the size of the Shooting Star candlestick. Also, the lowest and the closing prices of the day should have little-to-no distance.
When trading the Shooting Star candlestick, traders usually wait for a confirmation on the next day. If the candlestick marks a declining price, the traders open short positions. This is important because often, the Shooting Star candlestick may turn out to be a false signal or face a resistance that it is unable to break.

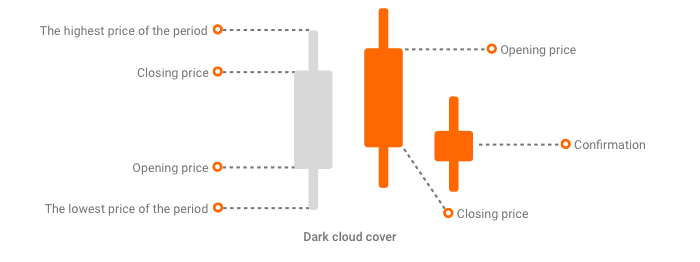
Dark Cloud Cover
The Dark Cloud Cover is another bearish reversal candlestick pattern. It occurs when the opening price of a bullish candle (black/red) is higher than the closing price of the bullish candle (white/green) for the previous day. The bearish candle should also close below the middle of the bullish one.
For a Dark Cloud Cover pattern to be confirmed, it is essential that the sequence of a bullish and a bearish candle (both relatively large in size) is closed by another bearish candle on the third day. It is critical for traders to make moves only when the pattern is confirmed by the third candlestick. Otherwise, it might be a false signal.
It is worth noting also that Dark Cloud Cover candlestick patterns also occur in small-sized candles, but in that case, the signal’s strength is way weaker, and it is better to trade only after solid market uptrends.
The Dark Cloud Cover is considered a highly-reliable and very powerful pattern that accurately indicates the shift in the direction of the market. However, it is important to trade it only if all of the above mentioned conditions are met.
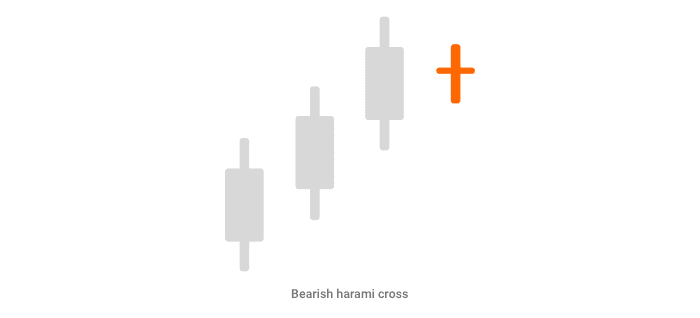
Bearish Harami Cross
The bearish Harami Cross is a trend-reversal pattern that occurs during positive market movements. A series of gradual bullish candlesticks are followed by a Doji candle. The Doji candle indicates that the open and close prices for the particular trading session are basically the same, as well as the indecision in the minds of the buyers. The Doji forms within the levels of the real body of the prior candlestick.
Similar to the Harami candlestick pattern, the Harami Cross also indicates that the trend is losing momentum. Before making a move, it is essential to wait for a confirmation of a bearish candle on the next day, after the Doji appears on the graph.
Usually, traders don’t rush acting when they spot the Harami Cross formation unless the price proceeds downside within the next couple of trading sessions. Bear in mind that, often, the price may pause for a while after the Doji candle.
Those who trade the bearish Harami Cross pattern often look at the location it occurs. If the formation appears near a major resistance level, then the pattern’s strength is high. Others also consider whether the RSI is moving lower from the overbought territory to confirm that a bearish movement actually takes place.
A part of the market participants considers using the pattern simply as an alert that a trend reversal is about to take place.
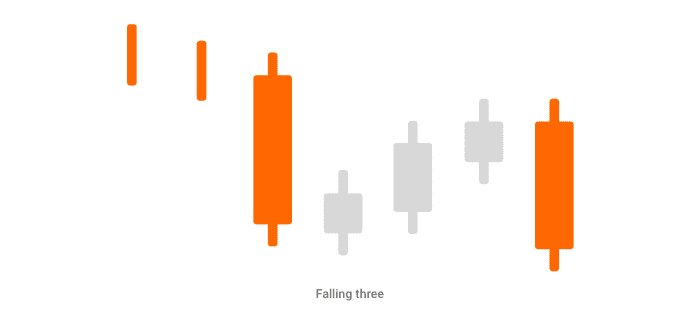
Falling Three
The Falling Three candlestick formation is a bearish continuation pattern that indicates interruption, but no reversal of the current trend.
It marks its start with a strong red/black candle. It is then followed by three small-bodied bullish candles (this isn’t often the case, although the second candle needs to be 100% bullish), all of which remain within the range of the first bearish candlestick (no new low price is reached). These three candles mark a period of consolidation. For the Falling Three candlestick formation to be completed, the three small body sessions should be followed by another strong bearish candlestick that closes in a lower low.
The Falling Three pattern helps traders recognize periods where bull-minded market participants still remain weak and unable to reverse the trend.
Trade this pattern only when the fifth day closes in a downward movement. Otherwise, you risk jumping into a trade on a false signal. If you are a more conservative trader, you can wait for another confirmation like the 10-day Moving Average to get close to the high of the fifth-day candlestick. Also, make sure that the candlestick formation isn’t anywhere near a key support level (a major trend line).
The majority of the above mentioned patterns have both – bullish and bearish variations.
Reversal Candlestick Patterns
Although most of the bearish and bullish formations that we covered already are reversal ones, here we will expand our horizon by focusing on three more advanced candlestick reversal patterns that are used by professional and experienced technical traders.
Hook Reversal Pattern
This short- to medium-term candlestick reversal pattern can be either bullish or bearish. Typical for either type is that it marks a lower high and a higher low than the previous candle.
In the example below, we will look at a bearish Hook Reversal Pattern. It starts during an uptrend that is followed by two consecutive bearish candles. The low of the last bullish day is marked either by the first or the second bearish candle. Traders usually act on the second day of the downtrend movement by placing a short trade.
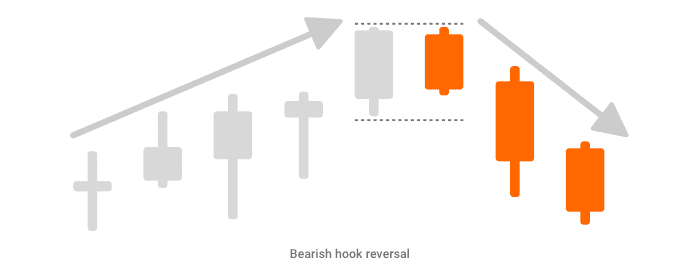
Understandably, the case with the bullish Hook Reversal pattern is quite the opposite. The first or the second bullish candle breaks the high of the last bearish one. Traders usually act on the second day with a positive price movement by posting a long trade.
The pattern is used mostly by advanced traders as it poses a significant risk of losses. Traders should be well-aware of their exit points before jumping into a trade. When trading the bearish Hook Reversal pattern, they usually place stop-loss orders above the recent high. For the bullish one, the stop-loss is placed below the recent low.
Bear in mind that the reversals here are very sharp, so anything else than that means the pattern is losing ground, and you should close your position immediately. Once the price slows down or starts moving in the wrong direction, make sure to head for the exit.
Kicker Reversal Pattern
As one of the most reliable candlestick reversal patterns, the Kicker formation is used by all modern-day technicians to spot sharp changes in the trend’s direction.
The Kicker candlestick reversal pattern can be either bullish or bearish. In the example below, we are looking at a bullish scenario. The formation starts after the last bearish candle when a huge bullish candle occurs. As you can see, the shift in the direction is significant, and the bullish movement starts very strongly. The second bullish candlestick serves as a confirmation about the positive trend reversal.

Trading this indicator is quite risky due to the major and sudden shifts in the trend’s direction. However, this is also part of the reasons why the pattern is so reliable and efficient. Technical traders who have mastered it usually make their moves near the close price of the first bullish candle (the Kicker candle) or the open of the confirmation candle (the second bullish one).
Stop-losses are usually placed right below the low price of the first bullish candle.
The Kicker pattern has proven to issue the most accurate signals when it occurs close to overbought or oversold markets. Although being among the strongest candlestick patterns, bear in mind that the Kicker pattern is quite rare.
Island Reversal Pattern
Another very strong candlestick reversal pattern is the Island formation. It indicates short-term changes in the trend’s direction, identified by a gap that forms between the main reversal candle, that is sandwiched between two other.
In the example below, you can see a bearish Island reversal pattern. After a series of bullish days, a reversal candle occurs, usually in the form of a Doji. However, it stands in some distance, much like the island is divided from the mainland. The following bearish candles are also distanced from the reversal one by the same gap. The gap, itself, represents the indecision among the traders and the lack of clear dominant force.
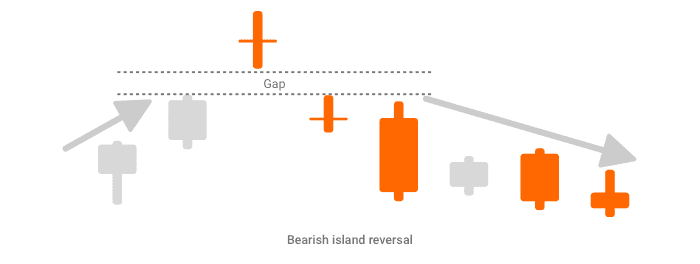
When trading the bearish Island candlestick reversal pattern, advanced technicians usually open short trades right after the gap and proceed to move in the opposite direction. Bullish traders open long trades after the gap and, once again, move in the opposite direction.
The key thing here is when to head for the exit. Make sure to look out for the way the price moves when within the gap. If it starts losing momentum or if it leaves the gap but then comes back, make sure to close your positions right away. Traders usually put their stop-losses within the gap or near the Doji candle (the island).
Conclusion About Candlestick Patterns
Having been around for centuries, candlestick patterns have proven to be one of the most efficient indicators for predicting the direction of the price trend of a particular liquid asset. Applied in almost all markets, Japanese candlestick patterns are a favorite tool for all types of traders – from beginners to professionals.
In this guide, we showed you some of the most popular basic and advanced candlestick chart patterns. If you are making your first steps on financial markets, make sure to deep-dive further and explore the wide universe of candlestick patterns to set the stage for a better-performing trading strategy.