Last Updated on June 8, 2021
The specter of interest rate hikes loomed over the US real estate market in 2018. A bevy of articles outlined the possibility of The Fed’s strategy triggering a process or chain reaction similar to the one seen in 2008. While many of them may have been wildly exaggerated, economists and investment analysts pointed out that increasing mortgage interest rates still carries the risk of causing a downwards price spiral on the real estate market.
The Fed began its rate hike cycle two years ago and peaked at 2.5% in 2018. The trend only became worrying once it reached 2%, at which point long-term mortgage rates suddenly showed a drastic increase. The process has been going on long enough for us to be able to evaluate it. To do so, we’ll use four indicators related to the real estate market: Building Permits, New Home Sales, Existing Home Sales, and the Case-Shiller Index.
You may also like:
Real Estate Indicator: Building Permits
The number of new building permits shows how optimistic the general population is about the real estate market’s future prospects. Although these permits aren’t necessarily required in every state or region, they’re necessary for the apartment housing complexes that make up most of the market.
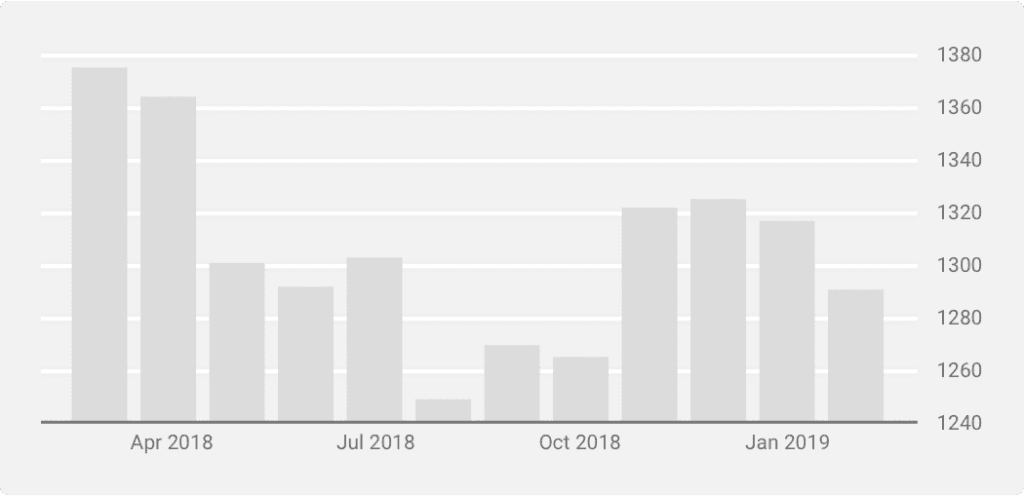
The above chart illustrates how much downwards pressure there’s been on the number of requested permits. The months where The Fed’s rhetoric acted the most hawkish are also where these requests were at their lowest. August, for example, was the month when they had the clearest vision of their interest rate trajectory, anticipating that they’d keep raising it until 2019. The added predictability offset the negative effects of the upwards pointing rate hike plan had on demand. This allowed the market to slowly recover over the following 2-3 months as it became evident that The Fed wouldn’t necessarily adhere to the original projection.
Although investors were quick to regain confidence, the figures began decreasing again in February. This implies that there may not be a definite correlation between permit requests and interest rate trajectory. This is because The Fed was fundamentally more dovish in this period due to the already high rates.

Real Estate Indicator: New Home Sales
New Home Sales may have a stronger correlation to The Fed’s policy. There’s some overlap when you compare the chart below with the previous one since they hit bottom at almost the same time. On the other hand, it didn’t experience the second decline and began rising instead.
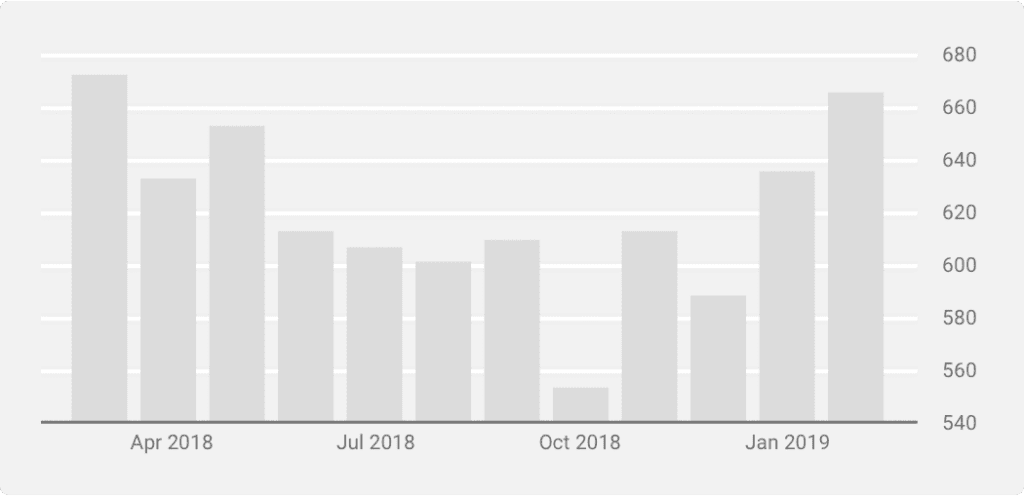
Looking at the chart, it’s clear that buyers may have become more careful of the rising interest rates. At the same time, they’ve also relatively quickly acclimated to the updated mortgage rates before returning to the market. After the rates stabilized at 2.5%, the long-term prospects of investing in new real estate remained positive.
Real Estate Indicator: Existing Home Sales
There’s also been a turning point in the sale of existing homes. We can see a steady downwards trend in 2018, followed by a sudden upwards spike in 2019. It suggests that potential buyers are simply playing the waiting game.
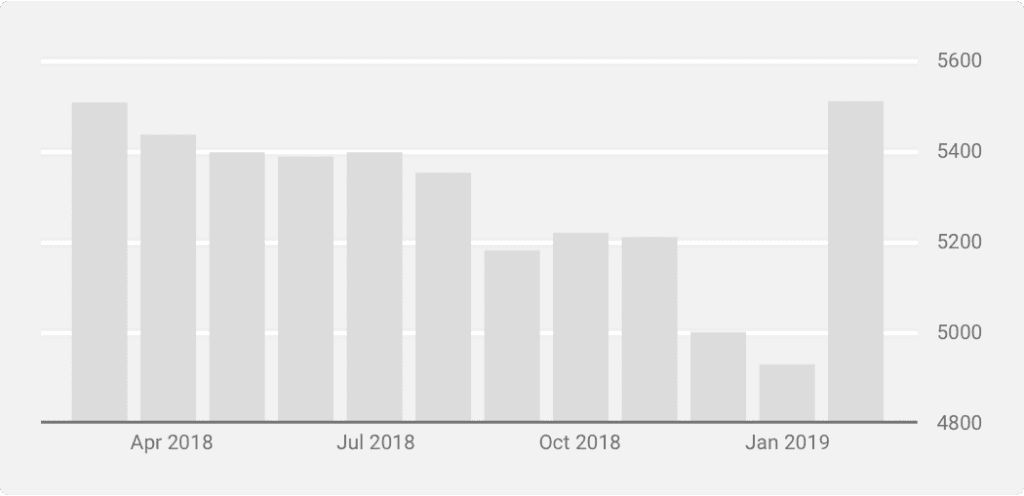
Once it became evident that rates wouldn’t rise further in the short term, they returned in droves. The February 2019 sales were close to what they were at the same time last year when interest rates were at 1%. It seems the predictability of interest rates plays a larger role than the actual interest rate figures themselves.
S&P Case-Schiller House Price Index
In the previous charts, we saw how demand shrunk, causing the number of permits to decline. Higher financing costs affect construction as well as sales since both are typically funded by loans. As the number of transactions decreases, one would expect prices to follow suit. However, the chart below suggests otherwise. Instead, the chart shows that 2018 was a good year for real estate prices. Prices climbed steadily at first due to the lower demand and despite the interest rates. The trend reversed around October. That was the same time period when we saw a reversal in the other charts as well.
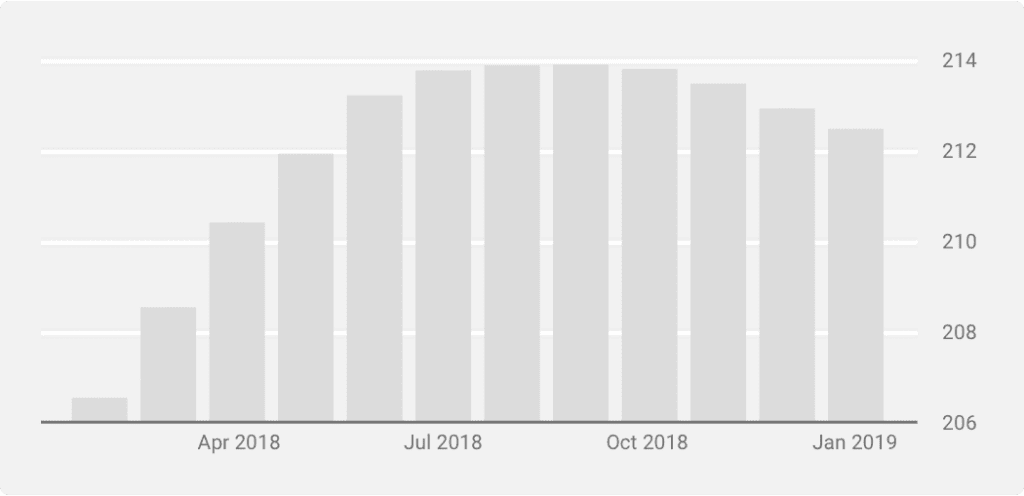
The market attempted to correct the increased financing costs by decreasing prices. In the end, the rate hikes indirectly caused prices to go down and bring buyers back to the market.
This begs the question of just how much an organization in charge of monetary policy trusts the market’s ability to self-regulate. In the end, The Fed’s treatment of consumers as capable and independent decision-makers has paid off. It’s encouraging to see how the real estate market stabilized without any kind of top-down intervention. At the time, Fed Chair Jerome Powell repeatedly expressed confidence in real estate market participants. In hindsight, his confidence was not misplaced.