
Last Updated on September 21, 2023
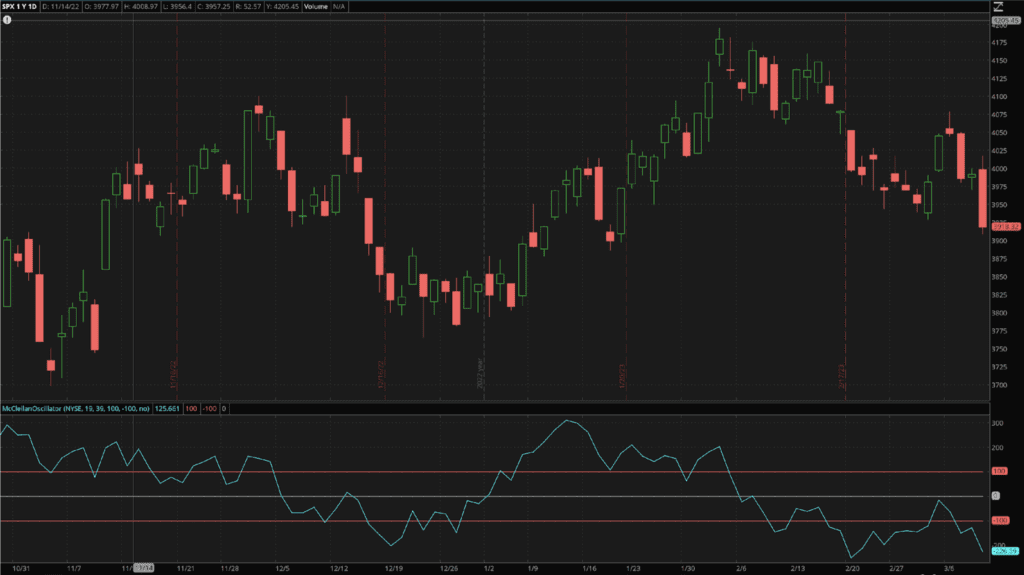
The McClellan Oscillator is a popular option for traders interested in assessing market trends’ strength and identifying potential reversals as part of an overall strategy. In short, the oscillator measures the difference between two exponential moving averages of the number of advancing and declining stocks in the market.
In doing so, it provides a visual representation of the market’s overall direction and momentum. In this guide, we’ll explore how to use the McClellan Oscillator, its formula, and how it compares to other oscillator indicators. We’ll also look at its advantages and disadvantages, as well as specific trading strategies that traders can use to make more informed market decisions.
What is the McClellan Oscillator?
The McClellan Oscillator is a technical analysis tool you can use to assess market trends and potential reversals. It was developed by married technical analysts Sherman and Marian McClellan in 1969 and remains widely used today.

In a nutshell, the indicator measures the difference between two exponential moving averages of the number of advancing and declining stocks in a particular market. Doing so provides traders with a visual representation of the market’s overall direction and momentum.
Note: As you may know, the simple moving average (SMA) treats all data points equally. The exponential moving average (EMA) is more responsive to changes in price trends since it puts greater emphasis on recent market developments than on older data. Traders use it to spot trends and potential changes in market direction.
For instance, when the oscillator is positive, more stocks are advancing than declining (more stocks are bought than sold). Traders usually acknowledge this as a sign of going long. On the other hand, if the oscillator is in negative territory, it means that more stocks are declining than advancing. This indicates that the market is selling stocks.
You can also use the McClellan Oscillator to identify potential trend reversals. When the oscillator crosses above the zero line from below, it could indicate that the market is starting to recover. On the other hand, when the oscillator crosses below the zero line from above, it could suggest that the market is about to decline.
What is the McClellan Oscillator Formula?
The McClellan Oscillator formula is a bit complex since it hinges upon first calculating multiple EMAs, as discussed previously. If you insist on doing the legwork, though, you subtract the 39-period EMA of declining issues from the 39-period EMA of advancing stock.
Wait – what are issues?
Since the McClellan Oscillator is a market-wide indicator or applied to a basket of stocks rather than a single instrument, issues, in this case, mean the number of stocks on an exchange or the instruments being assessed that increased or decreased in price during a given time.
Look at the SPX, for example – as the benchmark is comprised of the S&P 500, there are 500 stocks traded on an exchange, and 300 of them had a higher closing than the opening price, while the remaining 200 had a lower closing than opening price. As a result, the advancing issues would be 300, and the declining issues would be 200.
The formula for the McClellan Oscillator is:
McClellan Oscillator = (19-period EMA of Advancing Issues – 19-period EMA of Declining Issues) – (39-period EMA of Advancing Issues – 39-period EMA of Declining Issues)
The 19-period EMA represents the short-term trend, while the 39-period EMA represents the longer-term trend. By subtracting the longer-term EMA from the shorter-term EMA, the McClellan Oscillator shows you the momentum and direction of the market’s trend.
You can plot the McClellan Oscillator also as a histogram, which oscillates around a zero line. A reading above the zero line means the short-term trend is bullish, while a reading below the zero line suggests a bearish trend.
You can also look for divergences between the McClellan Oscillator and the price of an asset to identify potential trend reversals. For instance, if the price of an asset is making new highs but the McClellan Oscillator is not, it may signal a weakening trend and a possible reversal.

How to Trade with the McClellan Oscillator
Every trader’s toolbox is different. Even the way different traders apply one and the same indicator can vary. Still, the McClellan Oscillator is commonly used to:
- Identify overbought and oversold conditions: When the McClellan Oscillator reaches extreme levels, it can indicate that the market is overbought or oversold. A reading above +70 suggests that the market is overbought, while a reading below -70 indicates that the market is oversold.
- Look for divergences: Divergences occur when the McClellan Oscillator moves in the opposite direction of the price of an asset. For example, if the price of an asset is making new highs while the McClellan Oscillator doesn’t, it may signal a weakening trend and a potential reversal.
- Confirm trends: The McClellan Oscillator can also help you confirm the direction of a trend. If the oscillator is moving in the same direction as the price of an asset, it can provide additional confirmation of the trend.
- Use it in conjunction with other indicators: The McClellan Oscillator is just one tool in your toolbox. You can use it in combination with other technical indicators, such as moving averages or trendlines, to gain a more comprehensive view of the market.
McClellan Oscillator Trading Strategies
Let’s take a closer look at some specific uses of the McClellan Oscillator:
Overbought & Oversold
One way to use the McClellan Oscillator in your trading strategy is to identify overbought and oversold conditions. When the oscillator reaches extreme levels, it can indicate that the market is overbought or oversold.
A reading above +70 (although some argue that +100 is a more accurate estimation) suggests that the market is overbought, while a reading below -70 (again, some traders use -100 instead) indicates that the market is oversold.
Identifying these conditions can help determine potential trend reversals, as well as possible entry or exit points for your trades. However, it’s important to remember that extreme readings may not always lead to a reversal. To avoid being misled, make sure to combine the indicator with other technical and fundamental analysis tools.
Identifying Divergence
Another way to use the McClellan Oscillator is to look for divergences. They occur when the oscillator moves in the opposite direction of the price of an asset. For instance, if the price is reaching new highs while the McClellan Oscillator isn’t, it may signal a weakening trend and a potential reversal.
Confirm or Deny
Another way to use the McClellan Oscillator in your trading strategy is to confirm trends. If the indicator moves in the same direction as the price, it can further confirm the trend. For example, if the price is trending upwards, and the McClellan Oscillator is also moving in the same way, it can confirm that the trend is strong and likely to continue. On the other hand, if the oscillator is moving in the opposite direction of the price, it may indicate that the trend is weakening and signal potential reversals.
Advantages and Disadvantages
As with any tool, the efficiency of the McClellan Oscillator depends on the way it is used by the trader. However, the indicator comes with a series of unique advantages and disadvantages to consider:
Advantages:
- Identifying overbought and oversold conditions: The McClellan Oscillator can help traders identify potential overbought and oversold market conditions, providing insight into possible trend reversals.
- Divergence analysis: By comparing the oscillator with the price of an asset, traders can identify divergences that may signal potential trend reversals.
- Confirms trends: The oscillator can help traders confirm the direction of a trend, boosting the confidence in your trading decisions.
- Captures market breadth: By using the advancing and declining issues on a particular exchange, the oscillator captures the underlying strength or weakness of the market’s breadth rather than relying solely on the movement of individual stocks or indices.
- Provides a visual representation: Traders can plot the oscillator as a histogram, which makes it easy to interpret and analyze.
Disadvantages:
- Can give false signals: Like any technical analysis tool, the McClellan Oscillator can provide false signals, especially during periods of low market volatility or when market conditions change suddenly.
- Can be subjective: The choice of parameters, such as the period used to calculate the EMA, can vary from trader to trader, which may lead to different interpretations of the same data.
- Unreliable on its own: The oscillator is just one tool in a trader’s toolbox and should be used in conjunction with other technical indicators and fundamental analysis tools to ensure a comprehensive understanding of the market.
- Not suitable for long-term trends: The McClellan Oscillator is designed to identify short-term trends and may not work well for analyzing long-term trends in the market.
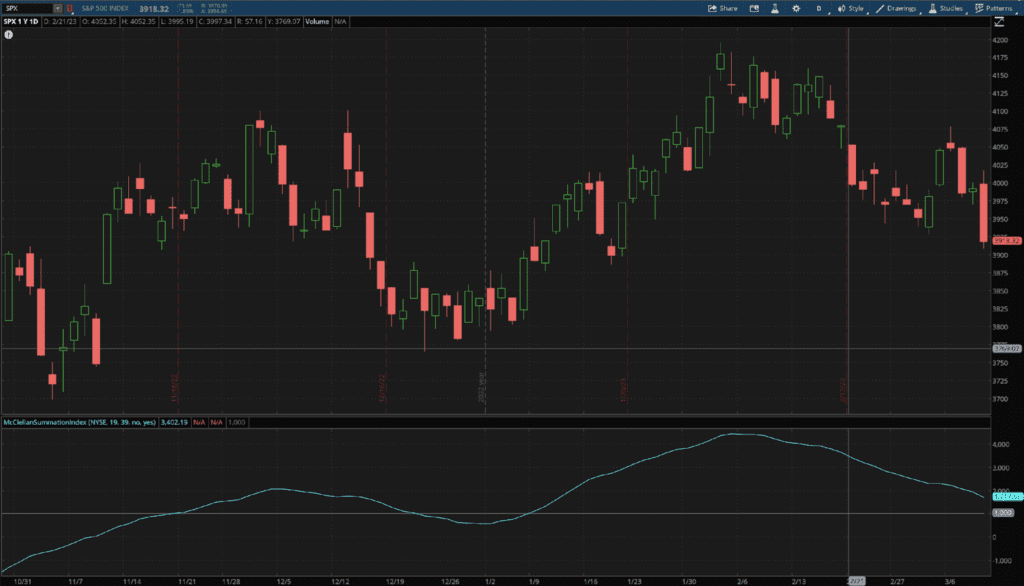
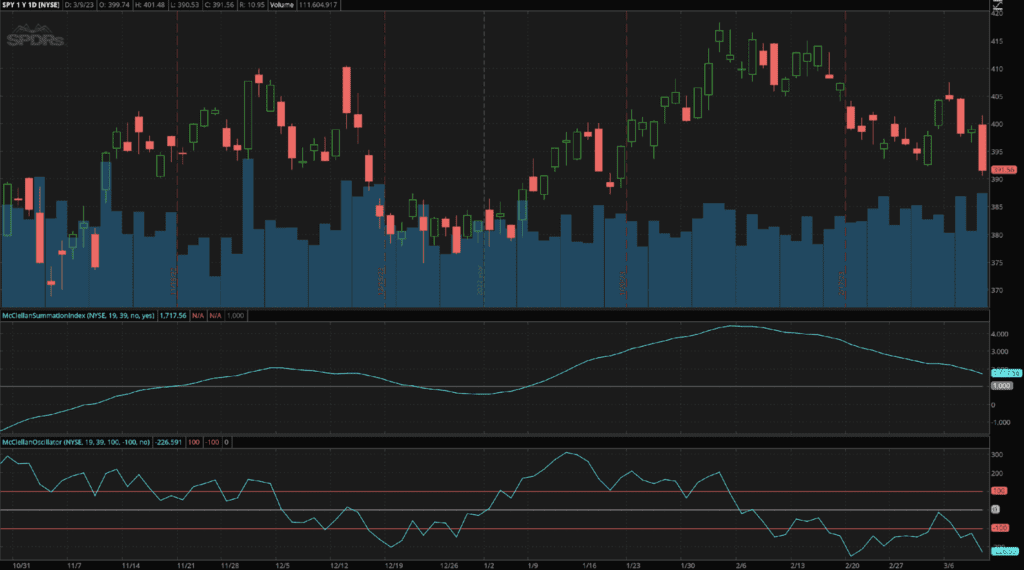
McClellan Oscillator and Summation Index
Like the McClellan Oscillator, the McClellan Summation Index is a technical analysis tool developed by the McClellans in the 1960s.
While the oscillator gives traders a visual representation of the momentum and direction of the market’s trend in the short term, the Summation Index, on the other hand, can be considered the longer-term version of the oscillator, calculated as a running total of its values. It is a cumulative indicator that provides insight into the underlying strength or weakness of the market’s breadth over a longer time horizon. The Summation Index is often used alongside the Oscillator to provide additional confirmation of a trend or reversal.
Both indicators’ output hinges on the same underlying data but serve different purposes and generate different signals. As a result, they are best used together rather than as opposing indicators.
Due to being a shorter-term indicator, the McClellan Oscillator is more volatile than the Summation Index and can create false signals during periods of low market volatility.
To balance the Oscillator, the McClellan Summation Index is a tested and reliable longer-term indicator that provides a more stable view of the market’s breadth over time. It is less volatile than the Oscillator and can give a more accurate view of the market’s underlying momentum.
McClellan Oscillator vs. Other Oscillator Indicators
While the oscillator is a unique tool, it shares similarities with other oscillators and can successfully complement them as part of a broader strategy. Some of the most popular oscillators include:
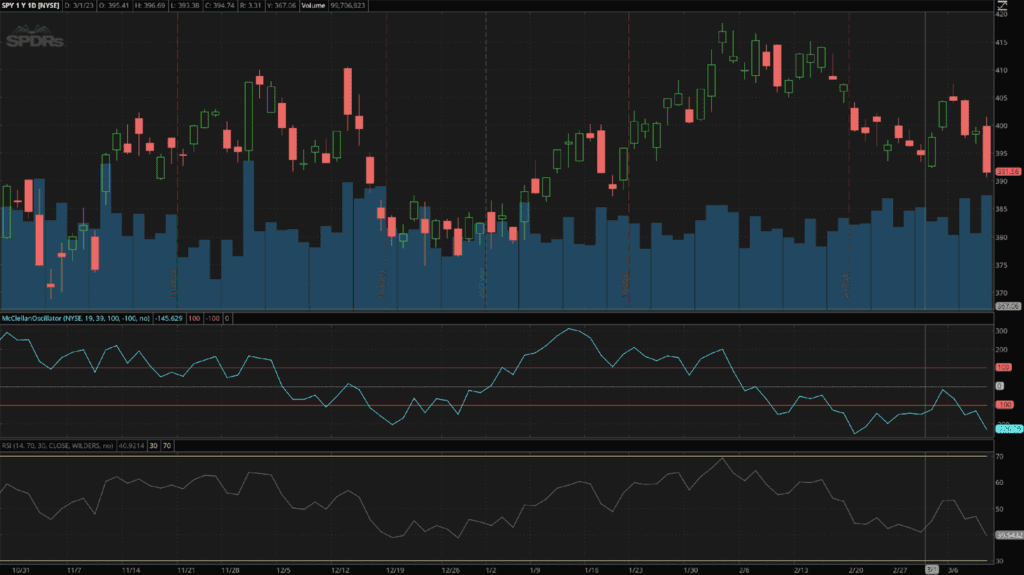
Relative Strength Index (RSI)
Like the McClellan Oscillator, the RSI is a momentum oscillator that measures the speed and change of price movements. It provides insight into overbought and oversold conditions in the market and can help you peg potential trend reversals.
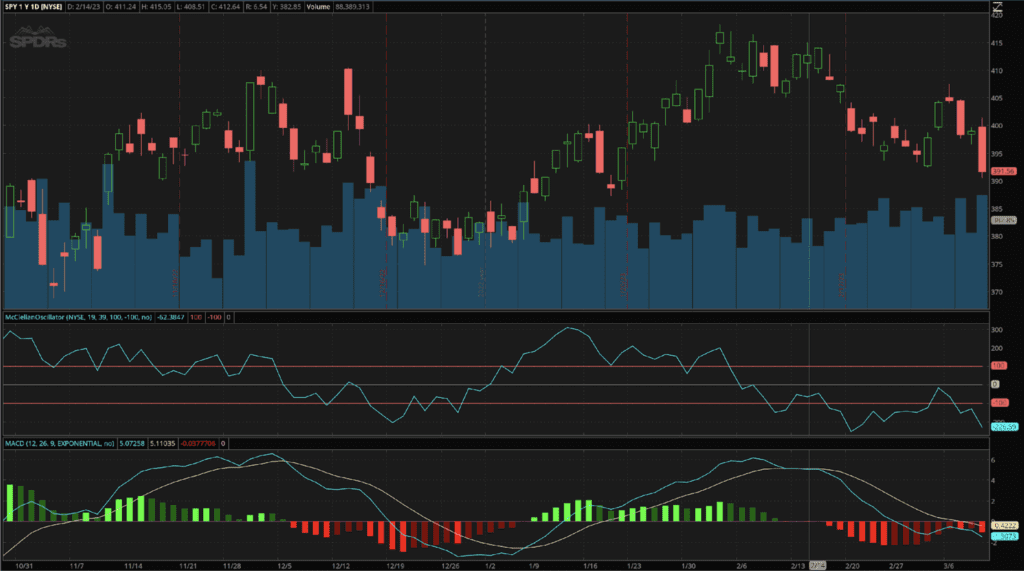
Moving Average Convergence Divergence (MACD)
The MACD is another momentum oscillator similar to the McClellan Oscillator in its use of moving averages.
However, the MACD measures the difference between two moving averages rather than the difference between advancing and declining issues. It can help traders identify trend reversals and confirm trend strength, much like the McClellan Oscillator.
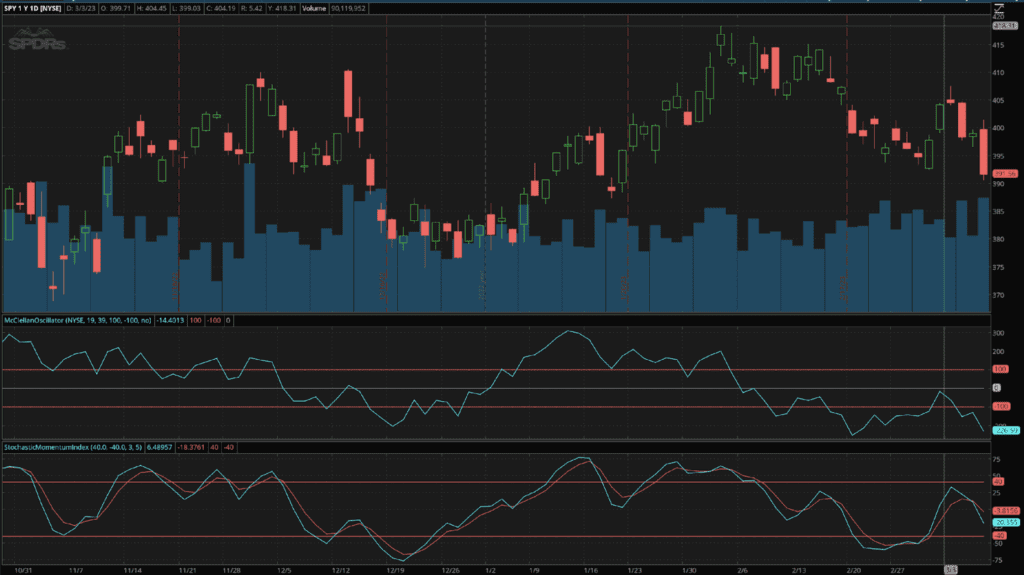
Stochastic Oscillator
The Stochastic Oscillator is an additional momentum indicator that compares the current price of an asset to its price range over a period of time. It can help traders identify overbought and oversold market conditions and provide insight into potential trend reversals.
Ultimately, each of the above-mentioned oscillator indicators is good on its own but even better as part of a broader strategy, and, in the end, it all depends on your preferred strategy. And, as with any technical analysis tool, most traders would be well-advised to use multiple technical and fundamental analysis indicators together to gain a comprehensive view of the market.
Conclusion
The McClellan Oscillator is a fantastic tool for traders whose strategy relies on identifying short-term market trends and their reversals. By measuring the difference between two exponential moving averages of the number of advancing and declining stocks, the oscillator gives users an accessible visual representation of the market’s overall direction and momentum.
You can use the indicator to identify overbought and oversold conditions, look for divergences, confirm trends, or alongside other indicators to gain a comprehensive market view. Its advantages include identifying overbought and oversold conditions, its usefulness in confirming trends, and the utility of providing a visual representation of the market’s breadth. However, like all tools, it also has disadvantages, including its potential to give false signals and its limited usefulness in analyzing long-term trends.
When used in conjunction with the McClellan Summation Index, the McClellan Oscillator provides a more complete picture of the market’s underlying momentum over time. Additionally, while the McClellan Oscillator shares similarities with other oscillators such as the RSI, MACD, and Stochastic Oscillator, each has its own “best use” case.
Overall, the indicator is a unique and valuable tool for traders looking to make informed decisions. By understanding how to use it and what are its advantages and disadvantages, traders can effectively supplement their trading strategies and gain an edge in an increasingly competitive market.