Most traders will agree that technical indicators are at the heart of any trading strategy. Traders use them to analyze past price trends and patterns, as well as forecast future market movements in order to make informed trades. While there are many different kinds of indicators available to traders today, the weighted moving average (WMA) remains one of the most popular. That’s thanks to its straightforward formula and its ability to measure market momentum. In this article, we’ll discuss what the weighted moving average is. We’ll also explain how to calculate it and take a look at some detailed examples.
What is the Weighted Moving Average?
The weighted moving average is a technical indicator that determines trend direction. It generates trade signals by assigning a greater weight to recent data points and less weight to past data points. The data points are usually asset close prices. It is a step further and more accurate than the simple moving average (SMA), which determines market movement by assigning identical weights to all the numbers in a given data set.
The WMA essentially computes the average of given input values over specified time periods by giving greater weight to more recent data. This is done by multiplying a weighting factor by each bar’s price in a given set and then summing up the resulting values. It is then used to smooth the data series to help filter market noise and make it easier for traders to identify data trends.
For instance, when the price moves towards or goes above the WMA line on the chart, it could signal that a price drop in the short-term is imminent. Therefore traders should exit the trade. However, if the price dips near or just below the WMA line, it could mean that the price may soon go up. Therefore it’s a favourable time to enter the trade.

You might also enjoy:
- Relative Strength Index (RSI) – What is it and how to calculate it?
- Fundamental Analysis – A Complete Guide from Basic to Advanced
A Brief History of The Moving Average
Traders, technical analysts, and statisticians have been using moving averages for many years. They are often categorized under a group of tools that deal with “Time Series Analysis”. Other tools in that group include the Arithmetic Mean, Covariance, Correlation Coefficient, and Variance. The development and use of moving averages is believed to date as far back as 1901. It wasn’t until a few years later that the name was associated with the technique for smoothing data points over a given period.
According to Investopedia, P. N. Haurlan was the first to use moving averages (exponential smoothing) to track stock prices. At the time, he referred to them as Trend Values and measured data and trend direction by their smoothing constants. Later, it became known as exponentially weighted moving averages (EWMAs). What we call the 19-day exponential moving average (EMA) today is what he called the 10% Trend. Over the years, moving averages have evolved in use across the financial markets as more and more traders turned to their many variations to make informed trading decisions.

How to Calculate the Weighted Moving Average
Calculating the weighted moving average involves taking recent data points and assigning a greater weighting compared to past data points. When summed up, the total value of the weights should be equal to 100% or 1.
As previously mentioned, the calculation for the weighted moving average is different from that of the simple moving average, where all data points are assigned an equal weighting. To calculate the SMA, you simply add up all the data points within a given period and then divide the value by the number of periods. On the other hand, the WMA considers the importance of each data point, which is reflected in the ‘weight’ assigned to it.
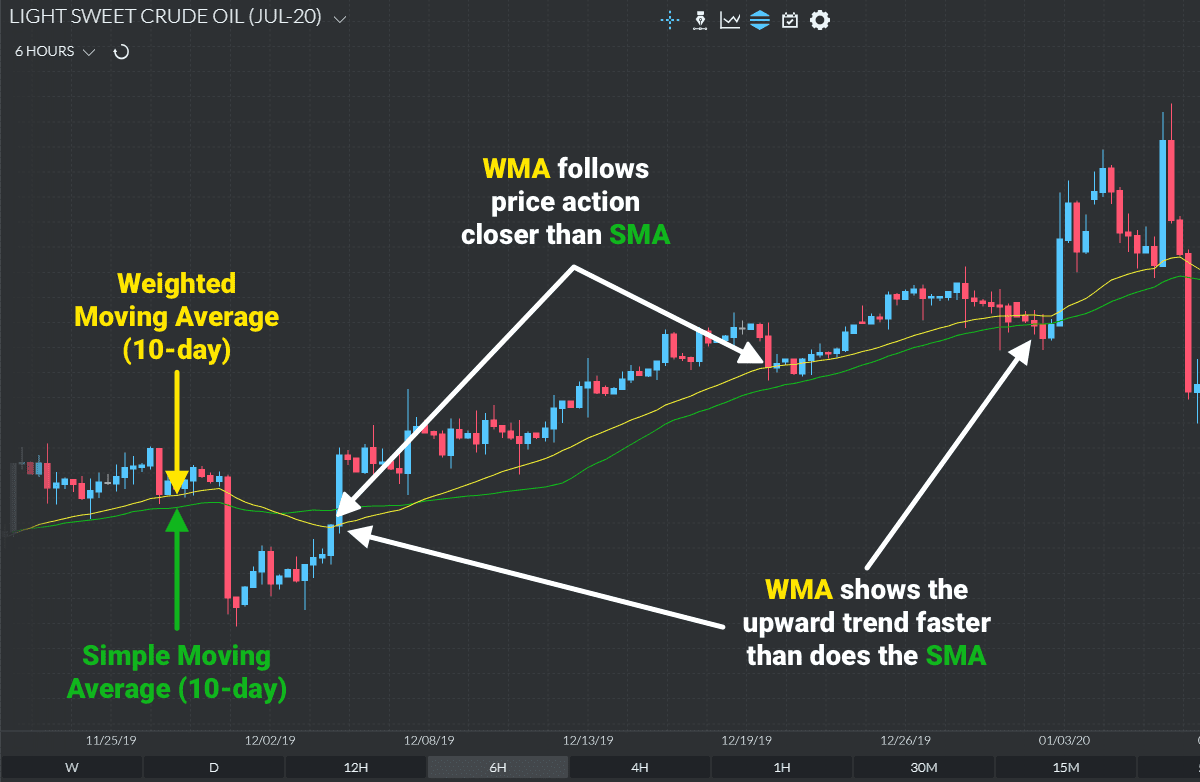
For this reason, the WMA is more descriptive and ultimately more detailed than the SMA. Additionally, it is more responsive to price action.
Weighted Moving Average Formula
The WMA formula is expressed as follows:
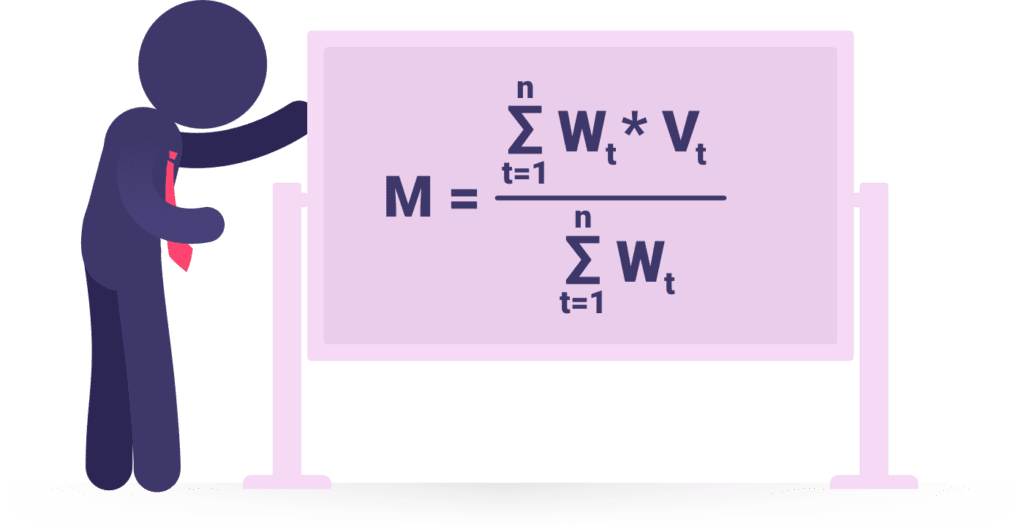
V = Actual value
W = Weighting factor
n = Number of periods in the weighting group
Source: help.sap.com
A bit confusing? Let’s use it in a few examples to give you a clearer picture of how to use this formula to calculate the weighted moving average.
Example 1
Suppose the closing prices of XYZ stock for the past 3 days have been $50, $45, and $60. Calculate the weighted moving average.
Step 1 – Identify the numbers to average
So here we have the three numbers provided — $50, $45, and $60, which were recorded over a three-day period.
Step 2 – Assign the weights to each number
Since there are 3 periods, the most recent day ($60) gets the largest weight of 3, the second recent day ($45) receives a weight of 2, and the last day ($50) receives a weight of just 1. Of course, this is only a simplistic representation. We’ll cover a more detailed weight assignment in the next example.
Step 3 – Multiply each price by the assigned weighting factor and sum them
Using the WMA formula, the calculation will go as follows: [(3 x $60) + (2 x $45) + (1 x $50)] = 320.
Step 4 – Divide the resulting value by the sum of the periods to the WMA
The sum of the periods is 1+2+3 = 6. So we have (180 + 90 + 50) / 6 = 53.33 as a three-period weighted average. The WMA value of 53.33 compares to the SMA calculation of 51.67. The division by 6 in this step is what brought the weightings sum to 6 / 6 = 1.
Let’s look at another example with a proper look at the weighted factor. Remember, they should add up to 100% or 1.
Example 2
Assume that we want to calculate the weighted moving average of five stock prices over a 7-day period. The prices are $50.25, $56.39, $58.91, $61.52, $59.32, 55.43, and 54.65, with the last price being the most recent. Now we have the numbers that we want to average so the next step is to assign the weighting to each number based on how recent they are and the given period.
| Day | Closing Price | Weighting Factor |
| 1 | $50.25 | 1/28 |
| 2 | $56.39 | 2/28 |
| 3 | $58.91 | 3/28 |
| 4 | $61.52 | 4/28 |
| 5 | $59.32 | 5/28 |
| 6 | $55.43 | 6/28 |
| 7 | $54.65 | 7/28 |
Next, we multiply each of the five closing prices by their corresponding weighting factor to find the weighted average.
| Day | Closing Price | Weighting Factor | Weighted Average |
| 1 | $50.25 | 1/28 | $1.79 |
| 2 | $56.39 | 2/28 | $4.03 |
| 3 | $58.91 | 3/28 | $6.31 |
| 4 | $61.52 | 4/28 | $8.79 |
| 5 | $59.32 | 5/28 | $10.59 |
| 6 | $55.43 | 6/28 | $11.88 |
| 7 | $54.65 | 7/28 | $13.66 |
| SUM | – | 1 | $57.05 |
Then you add up all of the weighted average individual values to arrive at the WMA. The WMA for the five stock prices over the 7-day period is $57.05.
How The Weighted Moving Average Works
Now that you know how to calculate the weighted moving average of a given set of values, let’s look at how you can use this indicator for your trades:
- To help determine trend direction – When the price is above its weighted MA line, it’s usually a signal that on average, the asset is trading higher than it has over the period being analyzed. This in turn confirms an uptrend. Alternatively, when the price is below the WMA line, then it confirms a downtrend.
- To indicate support and resistance areas – A rising weighted MA can indicate support for price action. While a falling WMA can indicate resistance to price action over a given period. Traders tend to use this as a strategy to place buy orders when the price is near the rising WMA or place sell orders when the price is near the falling weighted MA.
- To validate price strength and market momentum – Price action above its moving average shows that the market is getting stronger relative to where it was in the past since the most recent prices now sit higher than the average. On the flip side, price action below its moving average shows that the market is getting weaker relative to where it was in the past.
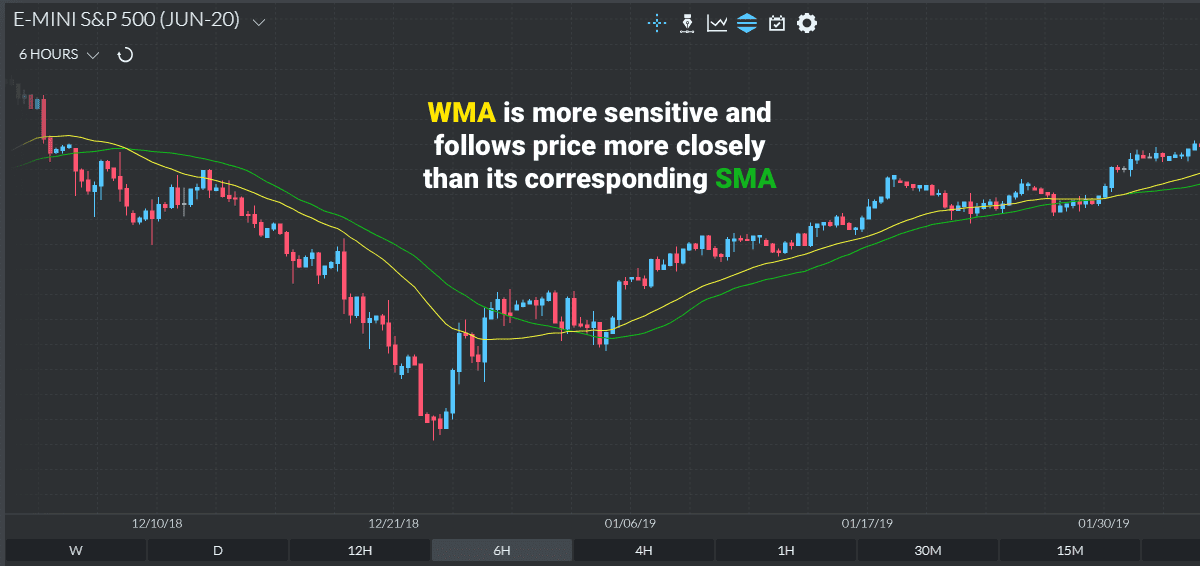
- To measure price movement – The weighted moving average is generally more sensitive to price movement making it a better measure as well as identifying trends sooner than the SMA. However, this can be a double-edged sword as the WMA is likely to experience more volatility than its corresponding SMA.
- To provide trade signals – The WMA can be incorporated with other technical indicators like Keltner Channels to spot ideal trade signals. Traders can enter the market near the WMA during an uptrend and there is a price pullback from the top of the Keltner Channel.
Conclusion
Knowing how to use the weighted moving average in conjunction with other technical indicators is an important skill to have as a trader. That being said, one type of moving average isn’t necessarily better than others as they simply have different calculation methods for average prices. As such, your trading strategy will ultimately determine what type of MA works best. Additionally, consider adjusting your settings slightly for each market; you may find that a 50-period WMA may provide great signals on one stock, but may not work so well on another. Like any other tool, the key is to know how to use and interpret the WMA to give you the best possible outcomes on your trades.