One of the first things you learn as a trader is that you can never get too comfortable if you are successful. Market cycles are constantly changing, so the strategy that got you your winning streak over the last few days, weeks, or months will not work forever.
Understanding how financial markets ebb and flow will significantly impact your potential profit and losses as a trader.
In this guide, we will go over what market cycles are about, what influences them, and how to adapt to different market conditions.
What are Market Cycles?
Market cycles represent the recurring patterns of growth and decline that characterize the behavior of financial markets over time. They are driven by economic factors, investor sentiment, and government policies.
For traders and investors, analyzing market cycles can provide crucial insights into when to buy, hold, or sell their assets.
A typical market cycle consists of four main phases — expansion, peak, contraction, and trough. Understanding how each works is key to knowing what to do when cycles change.
Expansion
This is the phase where everything seems positive. The economy is growing, employment rates are high, and consumer confidence is rising. It is a period of business expansion thanks to increasing corporate profits and high levels of investor and consumer optimism.
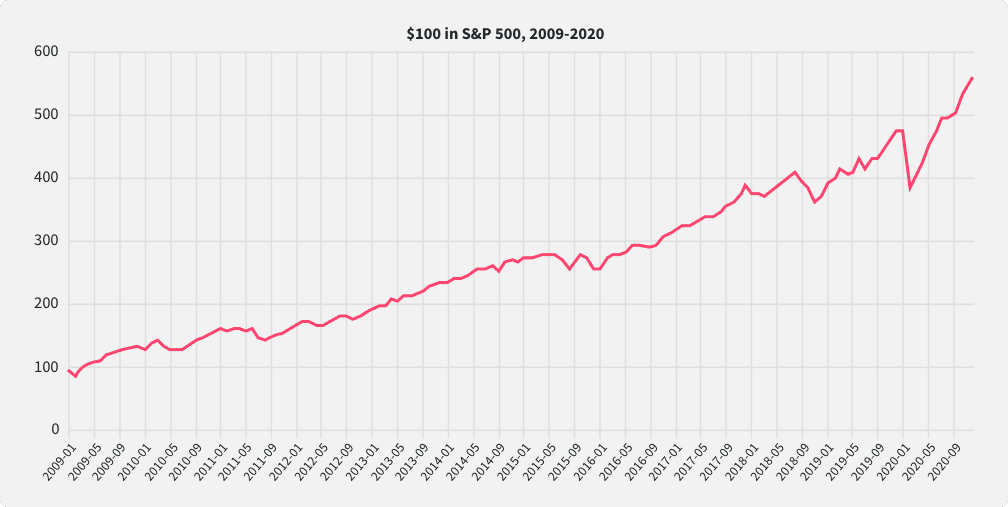
The stock market generally sees a steady uptrend with bullish sentiment dominating. For instance, from 2009 to early 2020, the U.S. experienced one of its longest expansion phases in history, with the S&P 500 Index growing over 300%.
Peak
As the expansion phase reaches its height, the market moves into the peak stage. This period is marked by the highest stock prices and economic indicators plateauing.
However, this level of investor euphoria often translates into speculative bubbles. Investor greed is at its highest, so buyers pour into the market in droves to avoid missing out. Signs of potential overvaluation may emerge, and eventually, the bubble pops.
The fundamentals catch up with the momentum, and the stock prices start to go down fast as traders look towards closing their losing positions.
An example of a peak phase is the period before the 2008 financial crisis when housing prices in the United States peaked, leading to a subsequent market crash.
Contraction
Also known as the “recession” or “downturn,” this phase is characterized by declining economic activity. Businesses report lower earnings, unemployment rates creep up, and there’s a general sense of pessimism among investors.
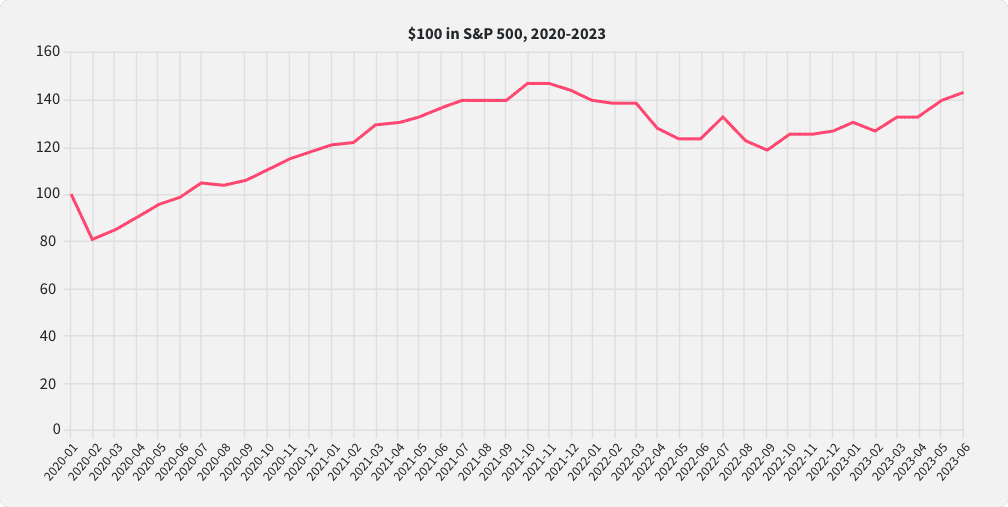
There is a significant risk of market corrections during this period, so traders are more cautious. The COVID-19 crisis in 2020 is a prime example of a contraction phase, where a widespread health pandemic and economic shutdown triggered a global recession.
Trough
The trough phase is the bottom of the market cycle. It’s a period when the economy starts showing signs of recovery. Investor sentiment starts to improve, paving the way for the subsequent expansion. During this phase, stock prices might show signs of stabilization.

Market Cycle Types
There are several types of market cycles that reflect the dynamic nature of economic fluctuations. While distinct, these market cycle types are interconnected, each influencing and being influenced by the others.
For example, the business cycle typically lasts a few years and is influenced by economic indicators like GDP and unemployment rates. This cycle can also largely impact the stock market and commodities cycles.
The credit cycle also reflects the ease or difficulty of securing loans. Every economy leans heavily on the lending and borrowing system. Expansionary phases see relaxed lending practices, while during contractionary periods, credit tightens.
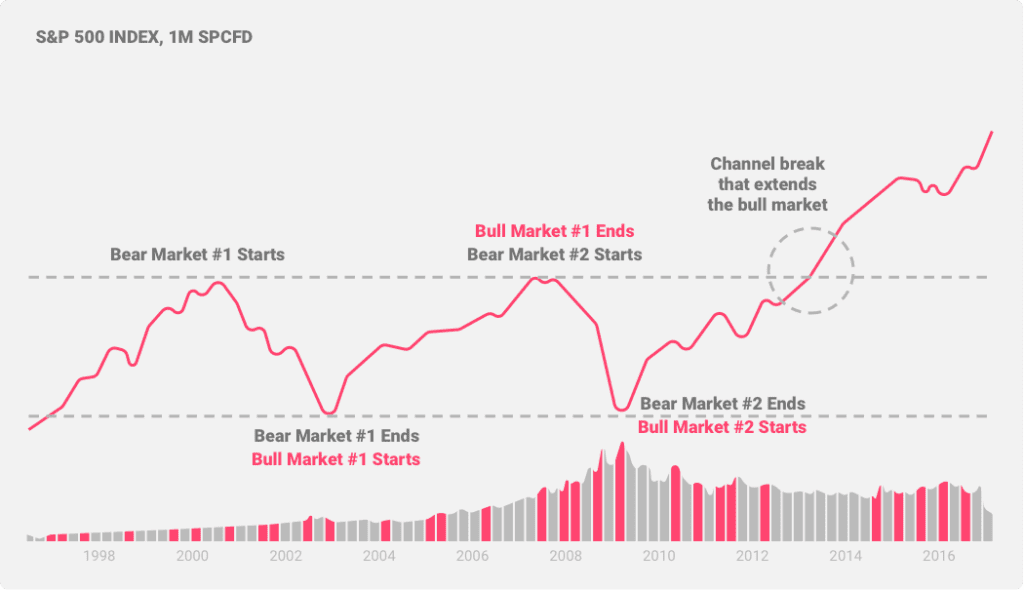
Broadly speaking, however, there are two primary types of market cycles — bull and bear markets.
Bull Market Cycles
This cycle represents a period when the market sentiment is largely optimistic. Buyers dominate, and there is a sustained increase in asset prices. Higher trading volume is another distinct characteristic of a bull market cycle. As confidence grows, more investors jump on the bandwagon, leading to higher trading volumes. Robust economic indicators, such as solid GDP growth, low unemployment rates, and soaring business earnings, often accompany bull markets.
Recognizing a Bull Market
Sometimes, the market presents false signals, so it’s not always easy to definitively identify if the cycle has turned bullish or is just short-term volatility.
One common indicator is a steady increase of 20% or more in a broad market index like the S&P 500. When these markets regularly hit and exceed previous high benchmarks, it signals that a bullish market cycle is likely in full swing.
Technical indicators, such as chart patterns and moving average crossovers, can also help in identifying and confirming the onset or dominance of a bull market.
For traders, bull markets present great opportunities for long positions, as prices are in an uptrend. It’s wise to spread investments across sectors during bull runs in order to capitalize on the broad market upswing.
In summary, while timing the precise start of a bull market is tricky, uptrend confirmation through benchmarks, technicals and sector analysis can give traders greater conviction in going long.
Bear Market Cycles
As the antithesis of its bullish counterpart, the bear market cycle is predominantly marked by pessimism and an extended decline in asset prices. There’s also diminishing consumer confidence and reduced spending all around.
The hallmark of a bear market is a fall of at least 20% from recent highs in broad market indexes. This leads to diminished trading volumes as traders and investors become cautious or fearful.
Unfavorable economic indicators, such as recessions, increasing unemployment rates, and shrinking corporate profits, often accompany bearish phases.
Recognizing a Bear Market
Consistent new lows, with the market regularly sinking below previous low points, are a common sign of a bearish cycle. Technical patterns like the “Death Cross” can also signal a downturn.
For traders, bear markets present opportunities in short positions as prices are falling. Short selling involves borrowing shares, selling them high, and repurchasing later at lower prices.
Defensive assets like gold, bonds and stable stocks often outperform in bear cycles and should be considered. Staying liquid is also wise, allowing flexibility to capitalize on bargains when the market bottoms.
In summary, while pinpointing the start of a bear market is difficult, consistent new lows, negative technical signals and defensive positioning can give traders conviction for short strategies.
The Economic Factors Affecting Market Cycles
The undulating patterns of market cycles don’t occur randomly. They’re primarily influenced by specific economic drivers. Knowing what factors affect market cycles helps you better anticipate the changes and make informed trading decisions.
Here are some crucial factors to keep in mind:
GDP Performance
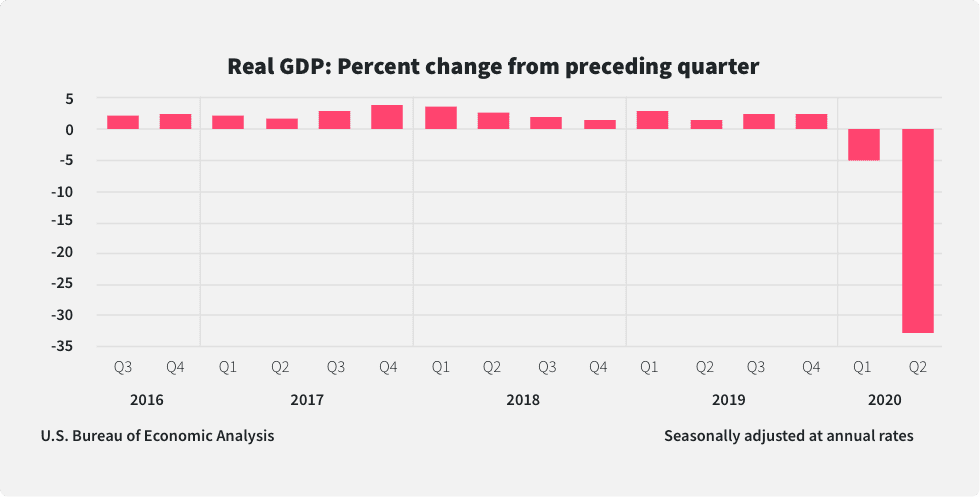
The Gross Domestic Product (GDP) is a key barometer of a nation’s economic health. For instance, during the COVID-19 pandemic in 2020, the U.S. GDP witnessed a sharp contraction of 32.9% in the second quarter, its steepest decline since record-keeping began in 1947. This downturn mirrored global market hesitancy and apprehensions.
Inflation
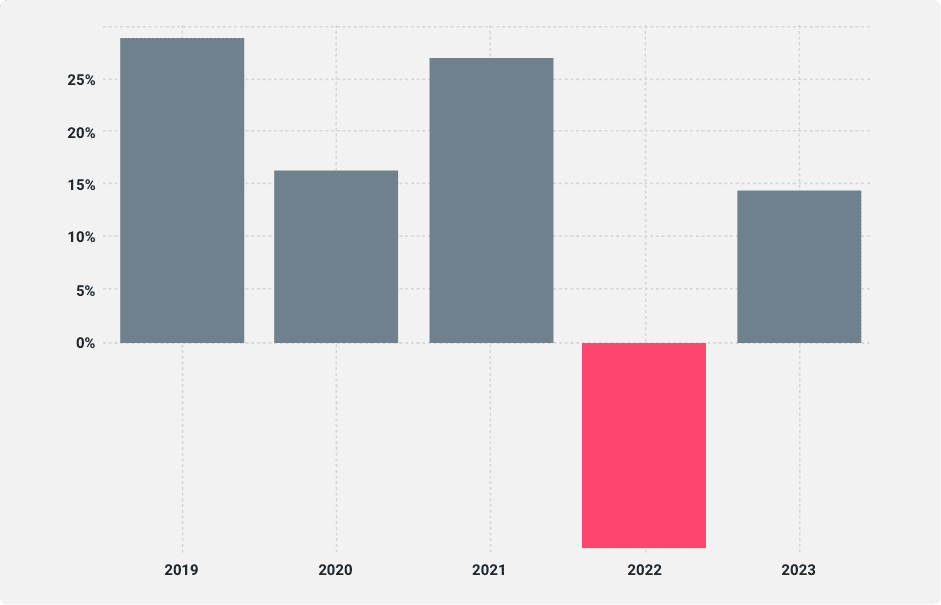
While controlled inflation signifies economic vitality, runaway inflation is troublesome. In mid-2022, U.S. inflation surged to its highest level in the last 20 years, reaching around 9.1% in June. This largely impacted the market in the same year.
Interest Rate Changes
Interest rates are central banks’ levers to modulate inflation and economic activity. In March 2020, the Federal Reserve slashed interest rates to near-zero, intending to bolster the economy amidst the COVID-19 crisis. Such reductions can stimulate borrowing and spending but might also fuel inflationary pressures.
Global Events
Global occurrences, from trade wars to health crises, can pivot market cycles. For example, the Russia-Ukraine war rippled through global markets, affecting various sectors, from technology to agriculture. Similarly, the rapid spread of COVID-19 in early 2020 and its resultant lockdowns paralyzed economies worldwide, causing wild changes in market cycles.
Forecasting Market Cycles with Indicators
Correctly forecasting market cycles often requires a mix of technical analysis tools and indicators. They can help you discern the rhythm of market cycles to better anticipate changes and make informed predictions about future trends.
Some popular indicators that can provide valuable insights into market cycle dynamics include:
Moving Averages (MAs)
Moving Averages (MAs) smooth out price data to create a single flowing line across a given period.
- Simple Moving Average (SMA): This represents the average price over a specific number of days.
- Exponential Moving Average (EMA): Prioritizes recent price changes over older ones, offering quicker reactions to price shifts.
MAs help spot trends. For instance, the “Golden Cross”—when a short-term MA surpasses a long-term MA—often signals a bullish turn, while the “Death Cross” suggests the opposite.
Oscillators
Oscillators move within defined ranges, indicating overbought or oversold conditions.
- RSI: Measures the speed and change of price movements, generally oscillating between 0 and 100. An RSI above 70 suggests overbuying, while below 30 indicates overselling.
- MACD: Monitors the relationship between two EMAs, assisting in spotting changes in the strength, direction, momentum, and duration of a trend.
Business Cycle Trends
The economy operates in phases, each having a distinct impact on stock markets. By understanding current business cycle stages—whether expansion, peak, contraction, or trough—investors can make informed decisions.
Consumer Sentiment Indexes
Indices like the University of Michigan’s Consumer Sentiment Index gauge consumer confidence. High consumer optimism typically indicates increased spending, propelling bullish markets, whereas dwindling confidence suggests the opposite.
Strategies to Adapt to Different Market Cycles
As market conditions shift between bullish and bearish, your ability to adapt will help you stay afloat even during extreme market volatility. If you’re not adaptable in your strategy, the market will force you out.
Some popular strategies for adapting through different market cycles include:
Buy and Hold (Long-term Investing)
This is the classic investment strategy extolled by the likes of Warren Buffett. Instead of jumping in and out of the market, you could buy stocks and hold onto them for extended periods. The S&P 500, for instance, has delivered an average annual return of about 10% (after inflation) over the last century, making long-term holding a profitable approach.
Plus, you don’t have to concern yourself with the changing market conditions since you’re in it for the long term.
Diversification
Spread investments across various asset classes and sectors to reduce risk. Having a mix of stocks, bonds, real estate, and commodities can help mitigate losses if a particular asset class underperforms.
For instance, in the 2000 dot-com crash, diversified portfolios with bonds, commodities, and non-tech stocks fared better than tech-heavy ones.
Defensive/Hedging Strategies
Tools like options and futures can hedge risk in uncertain markets. For example, purchasing put options on stocks during a bear market provides downside protection. If the stock price declines, the value of these put options would rise, effectively offsetting the loss from the stock’s fall. However, options trading is a complicated endeavor and should be exercised cautiously.
Follow the Big Money
While not a trading strategy itself, it is worth considering that “Big money” or large institutional traders drive major market moves. Retail traders add market activity, but big money flows are what steer the overall direction.
So when you see big money on the move, there’s likely to be a resulting movement in the market.
Trading the Volatility
For short-term traders, volatility presents opportunities. The VIX “fear gauge” reflects trading sentiment. The VIX can be traded using options or ETFs.
Heightened volatility, like at the 2020 pandemic onset, allows agile traders to capitalize on huge price swings. The VIX spiked over 82 in March 2020, its highest level since 2008. Astute traders leveraged this volatility, buying calls and puts on VIX and buying undervalued assets or employing short-selling strategies to profit from declining stocks.
Read also: Adapting Your Trading Strategy to Different Market Conditions
Conclusion
Every bull and bear market offers unique opportunities and challenges. By understanding market cycles, we can protect investments and capitalize on the inherent opportunities each phase presents. Mastering market cycle analysis is critical to trading success.