
Last Updated on October 12, 2023
Understanding technical indicators plays a significant role in trading. However, these tools may not be a hundred percent accurate. It is equally critical to fully grasp the underlying orders to understand a stock or derivative’s price behavior. This article will explain what order flow is and how you can devise trading strategies based on it.
What is Order Flow in Day Trading?
Order flow analysis is the process of studying the order flow and trying to predict how it might impact the instrument’s price. It allows you to see how other market participants are playing the market. Think of it as a microscopic look into candlestick patterns.
The order flow allows you to get a clear picture of the market forces. For example, if you see more sellers than buyers, you can expect that the sellers may have to quote a lower price to sell their stock. Likewise, more buyers would drive the prices higher since it gives the fewer sellers flexibility in choosing the price.
Each trader has their way of interpreting the order flow. Generally, the critical inputs in order flow analysis include the type of order (buy/sell), the order volume, and the price trend. Some traders are also interested in separating limit orders and market orders to understand better the direction in which the price will move.
It is essential to look at stock-specific and macroeconomic events to better understand the dynamics of order flow. Such events can quickly cause a spike in a particular order, which is a significant indication of where the asset’s price will likely be heading in the future.
Order flow analysis is often useful in the spot and derivatives markets and across multiple asset classes like equity, futures, and foreign exchange.


DOM, Market Orders, and Order Flow
It is essential to understand these terms before diving into their impact on the order flow.
DOM
DOM, or “Depth of Market,” shows the outstanding buy and sell orders for a given stock or futures. A higher volume indicates better liquidity or greater depth in the particular market. The deeper the market, the higher the prediction’s reliability. When the volume is consistently high, the impact of a single trade on the order flow is negligible (unless the volume is exceptionally high). In contrast, illiquid assets tend to get more volatile when there is a sudden increase in orders.
Market Order
A market order is an order where the trader agrees to buy or sell at the market’s current best available price. Market orders always get executed, but they can’t guarantee a particular price.
Limit Order
The order will only get executed if the price reaches a particular level. For a buy, the limit set is the maximum price the trader is willing to pay. If the price is higher, the buy limit order will not be executed. Similarly, a limit sell only gets executed if the price is equal to or above the limit set by the trader.
The link between the order type and the DOM
Suppose the DOM is driven by limit orders wherein the threshold set is far from the current price. Likely, such orders wouldn’t get triggered. In such cases, the DOM suggested by these limit orders may portray a false picture of the order flow. Any trader who places a trade just by monitoring the order book could witness a reverse price change. Limit orders are more reliable for most liquid assets because they move close to the market price.
Many traders prefer to observe market orders because they can execute them directly. This is especially true for illiquid assets because there could be instances when limit orders wouldn’t get filled up. Market orders would accurately depict the interplay between price and volume for such assets. It is, therefore, essential to do a deep dive into the DOM findings so that you can get a clearer understanding of the order flow.
Tools Used for Order Flow Analysis
As discussed previously, the simplest way to conduct an order flow analysis is to look at the order book. Since order flow analysis typically occurs in conjunction with technical analysis, we can usually see the relevant information alongside candlesticks.
Footprint Chart: The footprint chart is the most common tool for order flow analysis. It is reliable and shows only executed orders. Each bar in a footprint chart comprises multiple candlesticks. Each candlestick has multiple rows, and each row has two columns:

The numbers on the chart are separated by an x or | (x in the example shown above). The figure at the left shows the number of sell orders executed at a specific price level. Likewise, the number at the right highlights the buy orders. The solid bars are the candlesticks. The numbers are colored in green or red, signaling aggressive buying and aggressive selling, respectively.
Diving into a single candlestick
Let’s examine an individual stack of figures to better understand the numbers.
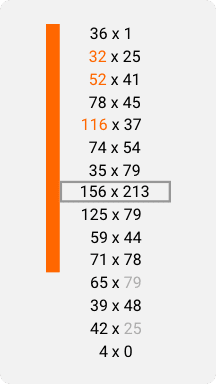
In the figure above, the top row indicates that 36 bid and one ask offers were fulfilled at that particular price level. The numbers are colored green or red depending on whether there is buying or selling pressure. For example, consider the second row from the bottom, where 25 is in green. Now, look at the row beneath it – only four sell offers are available that get filled, whereas a lot more buy offers (25) are executed at a higher price. This indicates a higher buying pressure, so 25 is marked in green.
To understand the numbers highlighted in red, let’s look at the first two rows. The number 32 on the left side (second row) is compared to 1 on the right side (first row). At the highest price, there is only one bid. On the other hand, 25 buy orders are available at a price point below. This suggests that aggressive selling is expected.
The figures in the black square indicate the volume point of control (VPOC). It is the price at which the maximum trading volume occurs. One hundred fifty-six buy orders and 213 sell orders get filled at the VPOC, which is much higher than the volumes at any other level.
We can configure footprint charts based on what the user considers aggressive buying or selling. Color coding is based on different degrees of pressure (buying or selling). We use lighter shades for less intense patterns and darker ones for more definite indications in footprint charts.
A Simple Order Flow Trading Strategy
Similar to technical charts, order flow tools are an effective way to detect patterns. Traders can use them alongside other indicators for greater effectiveness.
Let’s take the order book analysis, for example. It can often struggle to generate the required output since order books may contain unexecuted limit orders. For this reason, you can complement it with a footprint chart to determine the support level. Let’s look at the footprint chart shared earlier.
Check the fourth-last candlestick in which the lowest entry is 28×0. It means that no sell orders were executed at this point, or no buyers were willing to jump on the price. In the same entry, there is a bid-ask spread volume of 92×109. The green color indicates an aggressive bullish sentiment. This means that more buyers are available at this level, and therefore, a more significant number of sell orders have been executed. The price level is a support level, and the price is expected to increase, indicating a trend reversal. We can observe the same in the subsequent order flow pattern.
Likewise, we can identify a resistance level. The first row in the third candlestick is 0x3. This means that no sell orders could fulfill the bids at this level. Going to the next row, we see an entry of 18×55. More sell orders are now available for bidders at this lower price, indicating a resistance level. As more sellers are available at lower prices, the price is expected to drop.
Another simple approach would be to observe the VPOC for solid trends. An increase in the price level at the VPOC would indicate an uptrend, whereas a falling price level at the VPOC could signal a downtrend.
Real-Life Example of Order Flow Trading
Let’s look at a real example of order flow trading. While it is a standalone analysis based on a single tool, investors are advised to complement it with additional indicators and information. The following diagram illustrates how a footprint chart can help detect a buy signal.

Multiple instances of no sell orders were executed at the lower price level. We can see it in 47×0, 3×0, and 4×0. In all these instances, there was high buyer interest as more sell orders got fulfilled at a single price level above the lowest point. Additionally, we can see the VPOC at higher price levels for each order flow entry. Based on this assessment, one can expect the trend to be strong and place a buy order.
Similar conclusions can also be made for a strong downtrend. In such cases, the top row in each order flow wouldn’t have any bids for comparable sell orders. One row below would have a more considerable bid volume, indicating more interest from buyers at lower prices. The VPOC would occur at a lower price, and this trend would continue to drop. Once a trader observes these patterns, he can sell.
We can also use these charts to detect trend reversals. Traders can predict them by identifying the relevant resistance and support levels using order flow information. By customizing the strength of the order flow pattern, traders can determine whether the order flow gives a strong signal or not.
Key Takeaway
Multiple tools have been developed for order flow trading, from simple trade volume analysis to complex footprint charts. Many traders use flow figures and other technical indicators to confirm a pattern. Order flow is beneficial in detecting strong trends or trend reversals by identifying support and resistance levels. One can also grasp the liquidity of an asset by analyzing the bid and asking volumes for different price ranges. Furthermore, it helps identify specific high-volume trades that can impact the price. While many trading platforms may not support sophisticated order flow tools, there are ways to incorporate add-ons or purchase charting tools that support footprint charts.