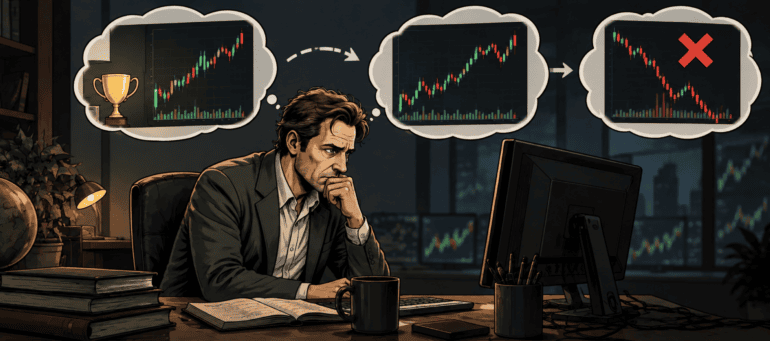
One of the most frustrating parts of trading is the losses where you can clearly explain why you entered, such as when the chart resembled a previous winner. Situations like these are often driven by the representativeness bias, a psychological shortcut in which people judge the probability of an event according to how closely it resembles a familiar example or category. In other words, when resemblance becomes evidence.
And participants in funded trading programs like Earn2Trade’s Trader Career Path® and The Gauntlet Mini™, who operate under strict rules, can’t afford to turn every familiar setup into a high-conviction trade.
This guide dives into the specifics of representativeness bias to help you identify situations where the market may look familiar, while the volatility regime, news environment, positioning, liquidity, and broader trend might be completely different. As a result, you will be better positioned not to make irrational decisions, but to take a step back and look objectively at the market situation.
What Is the Representativeness Bias and How Does It Work
As a result of the representativeness bias, we might end up making judgments without any probabilistic justification. As a result, we end up likening the current circumstances to those from the past, seeking similarities and giving them more weight than we actually should. Ultimately, it prevents us from looking objectively at the situation and can force us to make irrational decisions.
The concept is closely associated with the work of psychologists Daniel Kahneman and Amos Tversky (also known for their extensive studies on the anchoring bias), whose research showed that people can give too much weight to how representative something appears while giving too little weight to base rates and other relevant information.
That distinction is particularly important in trading because markets are built around pattern recognition. Traders spend years learning to identify breakouts, reversals, trend continuations, failed auctions, opening-range moves, liquidity sweeps, and other recurring structures, and then build a mental library of what different market situations look like.
It would be easy to misunderstand representativeness bias as an argument against technical analysis or discretionary trading. But, in reality, it isn’t. Pattern recognition is one reason experienced traders can process a chart quickly (e.g., someone who has spent thousands of hours watching futures markets will naturally recognize structures a beginner might not even notice).
The problem starts when recognition becomes projection. For example, let’s consider two traders looking at the same bullish reversal in Nasdaq futures. While both might see the price fall sharply, stabilize around a previous support zone, and begin forming higher lows, they might have different interpretations of the situation. Trader A thinks, “This resembles a reversal setup I’ve traded successfully before. I need to check whether the conditions that made those trades work are present today.” Trader B thinks, “I’ve seen this before. This is going higher.”
The chart is identical, but the difference is the treatment of uncertainty. While trader A is using the historical pattern as a hypothesis, trader B is using it as a forecast.
Just like in medicine – while two patients can present with the same symptom, they might be suffering from completely different conditions. The doctor’s job isn’t to diagnose a condition just because a symptom resembles something seen previously; instead, they have to take into account the patient’s history and additional evidence, both of which matter way more.
The Base Rate That Reinforces the Representativeness Bias
Representativeness bias becomes particularly powerful because the human brain tends to prefer vivid examples over statistical distributions.
Suppose a trader believes an opening-range breakout is one of their best setups. They can immediately remember several occasions when the market broke out and trended for hours. Those trades are easy to recall because they produced strong emotional and financial outcomes.
What is harder to remember are the failed breakouts, the sessions in which price moved only a few points before reversing, and the trades that required several attempts before producing a winner.
Now imagine the trader reviews 100 examples and discovers that only 54 produced the type of continuation they originally had in mind. The setup may still be profitable, particularly if winners are substantially larger than losers, but the discovery changes the trader’s understanding of the opportunity.
Namely, that it’s a setup with a distribution of outcomes. Research in behavioral finance has repeatedly found evidence that investors extrapolate recent performance into their expectations of what comes next. As a result, they can place substantial weight on recent returns when forming beliefs about future performance, leading to substantial losses.
Just think about it – in reality, a strategy with a 55% historical win rate can produce a string of losses, while a strategy with a 40% win rate can produce a string of winners. Since short sequences are noisy, and the brain is extremely good at turning noise into a story, funded traders have to look beyond just profit and loss.
For example, they should consider keeping a journal to record the conditions surrounding each setup: time of day, volatility, broader market direction, opening gap, proximity to major levels, volume, scheduled economic events, etc. The objective is to discover not simply whether a setup works, but when it works. We will dive into the strategies to protect yourself from the representativeness bias in the next sections.

Why the Representativeness Bias Can Affect Funded Traders Significantly
Representativeness bias can affect any market participant, but funded trading can create conditions that make it particularly persuasive.
The first is repetition, for example. Traders preparing for evaluations often study the same setups repeatedly, replaying sessions, collecting screenshots, and reviewing examples of trades they would like to reproduce. This repetition is useful because it builds pattern recognition. However, the trader can eventually become so familiar with a setup that the label begins to feel more important than the conditions beneath it.
And once something has been categorized as a “high-probability setup,” contradictory evidence becomes easier to dismiss. A lack of follow-through might become a temporary pause; a move against the position might become a stop-hunt; and weak volume might be considered irrelevant. As a result, the trader can continue looking for evidence that the situation still belongs to the category they assigned to it.
The second reason is rooted in the profit target. A trader trying to reach a funded-program target may be particularly attracted to setups associated with large historical winners, and the desire to make meaningful progress can then quickly turn recognition into urgency (e.g., “This is the setup I’ve been waiting for, so I need to take advantage of it.”)
In such situations, representativeness can interact with overconfidence, making a familiar setup feel safer than an unfamiliar one, even though familiarity has no inherent relationship with future profitability.
The third issue is risk asymmetry. In a funded environment, a trader may have limited room to absorb mistakes before reaching a drawdown threshold, which makes overconfidence especially costly. However, a participant doesn’t need to be catastrophically wrong – they only need to repeatedly take marginal trades because those trades resemble previous winners. While a $200 loss is manageable, a $200 loss followed by another $250 loss, followed by an oversized “high-confidence” trade because the trader believes the setup can’t fail, can quickly become a serious account problem.
The important thing to remember is that the representativeness bias often feels like expertise. But, at the end of the day, expertise isn’t simply seeing similarities – it is knowing which differences matter.
Mind the Winning Streak Trap
The representativeness bias can become even stronger after a run of successful trades. For example, let’s imagine a trader who has taken the same Nasdaq setup five times and won each time. By the sixth occurrence, the trader’s behaviour has changed, and he considers the previous outcomes not merely historical data but part of his perception of the current setup.
They might then start increasing their position size or loosen entry criteria. They might even become more willing to hold through adverse movement.
But at the end of the day, a winning streak doesn’t necessarily mean that the edge has become stronger. Instead, it might simply be a favorable sequence within the distribution of outcomes, and even if market conditions have genuinely become more favorable, the trader needs to seek evidence before deciding to change the risk model drastically.
A useful mechanism to keep things under control is calibrating your confidence by asking yourself not whether you believe a trade will work, but whether that belief is backed by data and evidence (not your own conviction). At the end of the day, if historical data says your setup wins 57% of the time, five recent winners won’t turn it into a 90% setup.
This is particularly important for funded traders because winning streaks can create a false sense of security precisely when discipline is most necessary. A participant who has passed several difficult sessions may begin increasing their size to accelerate progress, believing that their recent success confirms their ability to read the market. While that might indeed be the case sometimes, more often than not it simply means they have been on the favorable side of variance. And to be sure of that, you need a sufficiently large sample.
Social Media Can Amplify the Bias
Modern traders have one source of reinforcement that previous generations didn’t have to the same extent – the constant stream of other people’s charts. Just scroll through trading social media during a volatile session, and it is easy to find historical comparisons – “today’s S&P chart looks like 2020,” “crude is repeating a structure seen before an earlier geopolitical move,” etc.
These comparisons can certainly be useful, yet they are often economically incomplete, since two charts can look nearly identical while the underlying drivers are completely different. Interest rates may be moving in opposite directions, positioning may be different, liquidity may have changed, a previous breakout may have followed a major catalyst that has no equivalent today, etc.
The more traders repeat the same comparison, the more social proof there is, and soon what began as one person’s hypothesis might start looking like consensus.
As a funded trader, the solution isn’t necessarily to avoid social media completely, but to keep a strict boundary between idea generation and trade validation. And always make sure that, while someone else’s chart might trigger your curiosity, it shouldn’t make you risk money.
A useful test is to take any historical comparison you see and identify three meaningful differences between the two situations. If you can’t find them, look harder. The exercise is designed to counter the brain’s natural preference for similarities.
The same principle applies to trading communities and chatrooms. If everyone is describing the market in the same language, that can actually be a reason to slow down rather than become more confident. Don’t forget that consensus doesn’t equal confirmation.
A Practical Checklist Against the Representativeness Bias
You can’t eliminate intuition – that’s unrealistic and counterproductive. As a result, you can’t eliminate the representativeness bias completely, so the goal here would be to put a small amount of friction between recognition and execution.
So, to do that, make sure to ask yourself a couple of simple questions before entering a trade, such as:
- What exactly am I seeing?
Describe the market without using the setup’s name. Instead of “perfect bullish reversal,” write something observable, such as price reclaiming the previous session’s low, forming two higher lows, and holding above VWAP.
- What is the base rate?
If the setup is part of your playbook, know its historical results. A 55% setup shouldn’t be traded as though it has a 90% probability of success.
- What is different today?
Identify at least two meaningful differences between the current market and the historical examples influencing your decision.
- What invalidates the trade?
Establish the price or market behavior that tells you the original thesis is wrong before the position is open so that you are less likely to negotiate with yourself afterwards.
- Am I sizing the trade because of evidence or familiarity?
Note that a setup doesn’t deserve greater size merely because it reminds you of a profitable trade. That last question is particularly important in funded accounts, where position size should reflect the risk parameters of the strategy and the account, not the emotional strength of the trader’s memory.
Mind the Market Regime Problem
Perhaps the most costly form of representativeness bias occurs when traders recognize a pattern correctly but fail to recognize that the environment has changed. However, in reality, a strategy that performs beautifully in a low-volatility, orderly market can behave completely differently when volatility expands.
For example, mean-reversion strategies can struggle when a market transitions into a strong trend, while breakout systems can perform poorly during compressed, range-bound conditions. Or a setup that worked repeatedly during quiet sessions can become unreliable when major economic announcements start producing violent two-way movement.
So, before trading a familiar setup, ask what has changed since the examples you are remembering. Is volatility higher? Is there a major report approaching? Is the market opening with an unusually large gap? Are correlated markets confirming the move? Has the broader trend changed? Is liquidity thinner than normal?
Here is a quick and simple framework to help you in that process:
| Familiar Setup | What Might Be Different Today? | Question Before Entry |
| Opening-range breakout | Volatility is unusually high | Does the setup still perform under this volatility regime? |
| Support bounce | Broader market is strongly bearish | Is this a reversal or merely a temporary reaction? |
| Trend continuation | Major economic release is approaching | Does the event change the trade’s risk profile? |
| Failed breakdown | Related markets remain weak | Is there enough confirmation for a reversal? |
| Repeat of a recent winner | Different time or market conditions | Am I trading the setup or the memory of it? |
What to Do If the Bias Follows You Into the Trade
One last thing that’s important to note is that representativeness doesn’t stop once the order is filled – in many cases, that is when it becomes more dangerous. For example, suppose a trader buys a reversal because it resembles a previous winning setup. The price then moves against them, and instead of reassessing the position, the trader remembers that the previous trade had also gone slightly underwater before turning into a winner.
The historical example now becomes a reason to hold. The trader has stopped evaluating the current market and is managing today’s position based on yesterday’s memory. That can produce familiar forms of bad trade management: widening stops, averaging down, refusing to accept invalidation, and holding because the “real move” has not happened yet.
As a funded trader or participant in a funded trading program like Earn2Trade’s Trader Career Path® and The Gauntlet Mini™, it’s critical to separate entry logic from management logic. While the historical pattern can help justify why the trade was considered, it shouldn’t determine how much loss the trader is willing to tolerate once the market provides new information.
Closing Remarks
Representativeness bias ultimately comes down to a simple mistake: confusing familiarity with probability. While markets reward traders for learning from the past, they don’t promise to reproduce it. The same chart pattern can appear in completely different environments, and a losing streak can follow a winning streak, or a setup that worked perfectly last week can fail today without the strategy itself becoming useless.
For funded traders, the consequences are magnified because their accounts have a finite risk budget. So, the goal isn’t to prove that your pattern recognition is correct, but to make enough good decisions while controlling enough risk so that your strategy’s advantage has time to express itself.
At the end of the day, one should continue using their intuition and rely on their instincts, but what’s most important is learning to take a step back and ask questions that will back that conviction with market data (e.g., ask what the historical examples have in common, look for differences, consider the market regime, examine correlated markets, define invalidation, etc.) Then let price tell you whether the thesis is working.
Or in other words, make sure never to allow confidence in a familiar pattern to become an excuse for violating your risk process. While this might cost you the first part of a move and earn you less money, it’s worth it. The dangerous alternative is believing that because today’s market looks like yesterday’s, today’s outcome is somehow obligated to resemble yesterday’s. But the chart can rhyme without repeating.