Last Updated on June 27, 2022
The Arms index, also known as the Short-Term Trading Index or TRIN, is a short-term technical indicator used to compare the number of advancing and declining stocks (AD Ratio) to advancing and declining volume (AD volume). Developed by Richard Arms in 1967, the TRIN is used to gauge overall market sentiment. With the TRIN, investors can evaluate the relationship between market supply and demand. This helps them anticipate future intraday price movements. The TRIN signals overbought and oversold levels that will indicate when stocks are most likely to change direction.
The Arms Index Formula and Calculation
The formula for the Arms index (TRIN) is as follows:
TRIN = (Advancing Stocks/Declining Stocks) / (Advancing Volume / Declining Volume)
- Advancing Stocks = Number of stocks higher for the day
- Declining Stocks = Number of stocks lower for the day
- Advancing Volume = Total volume of advancing stocks
- Declining Volume = Total volume of declining stocks
Although most technical charts already include the TRIN indicator, it can also be calculated step by step like so:
- Choose your set intervals. They can be every five minutes, every hour, daily intervals, etc.…
- Divide the number of advancing stocks by the number of declining stocks to calculate the AD Ratio.
- Next, divide the total advancing volume by the total declining volume to get the AD Volume.
- Then divide the AD Ratio by AD Volume.
- Record the result and plot it on a chart.
- Repeat the same steps at the next interval.
- Connect the data points to form a chart and see how the TRIN trends over time.

You might also enjoy:
- Commodity Channel Index (CCI) – How to Use The CCI Indicator
- Bull Trap – Using Point and Figure Charts to Avoid False Signals

What Does the Arms Index Tell You?
By analyzing both the strength and breadth of stock movements, the Arms index provides investors with a real-time explanation of market indexes’ overall movements.
A value of 1.0, for example, indicates that the market is in a neutral state. Why? Because a value of 1.0 means that the AD Ratio is equal to the AD Volume and that up volume is evenly distributed over advancing stocks. In contrast, down volume is evenly distributed over declining stocks.
The TRIN indicator provides a bullish signal when it is less than 1.0. When it is greater than 1.0, then it’s a bearish signal. Alternatively, when it is less than 1.0, there is a greater volume in the average up stock than the average down the stock. When the level is greater than 1.0, there is a greater volume in the average down stock than the average up stock. The further from 1.0 that the TRIN indicator’s value is, the greater the contrast between buying and selling on that day or interval. A strong up day, for example, will push the TRIN down. Meanwhile, a strong down day will push the TRIN up.
How Does TRIN Work?
The TRIN is a breadth oscillator that helps measure internal market strength or weakness. It is a short-term technical trading tool that measures volatility in the stock market and represents the relationship between advancing and declining stocks and their volume. If the TRIN is trending upwards, that means the market is weaker: Conversely, if it is trending downwards, that means the market is stronger. The TRIN often moves inversely to the index being analyzed. When it spikes higher, sell-offs usually occur. When the TRIN drops sharply, rallies usually occur.
Often the moving average of the index is included as well when evaluating the TRIN. By analyzing the moving average, the data can be smoothed out while giving investors a better understanding of whether the trend is up or down. The moving average also aids in identifying support or resistance areas.
Finding Overbought and Oversold Levels with TRIN
Because the TRIN is a breadth indicator, finding overbought and oversold levels in major indexes is one of its main goals. While we already mentioned that 1.0 is the neutral value and that the TRIN moves inversely to an analyzed index, very high or low readings in the indicator may signal that levels are either overbought or oversold and due reversal. While overbought and oversold levels may vary slightly by index, the TRIN can always tip us off. When the value of the indicator dips below 0.50, that may indicate overheating and an overbought market. When the indicator’s value exceeds 3.00, that may indicate an oversold market and with an over-extreme bearish sentiment. While the TRIN indicator isn’t always correct, it is a valuable resource when tipping off investors before a dramatic price shift or reversal.
How to Trade Using the TRIN Indicator (with Examples)
The TRIN indicator is particularly beneficial when day trading or swing trading. Traders look at the value of the indicator and how it changes throughout the day. They also look for extremes in the index value and are always looking for signs that the market may soon reverse.
Example 1
When using the TRIN indicator, it is best to combine it with other indicators. Examples of such can include the moving average or Bollinger Bands to help avoid miscalculations and false signals.
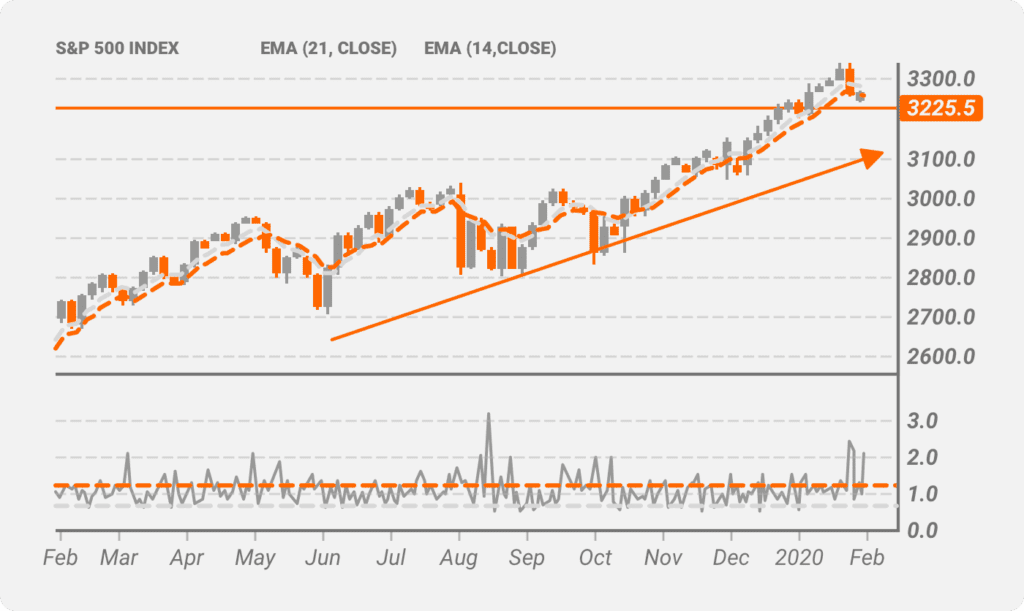
The example above shows the S&P 500 in an upward trend for one year. As the S&P was trending upwards, the TRIN indicator was below 1.0, further confirmed by the double exponential moving averages.
Example 2
The below chart is another example of how to trade with the TRIN indicator. This chart compares it with key turning points in the Nasdaq.
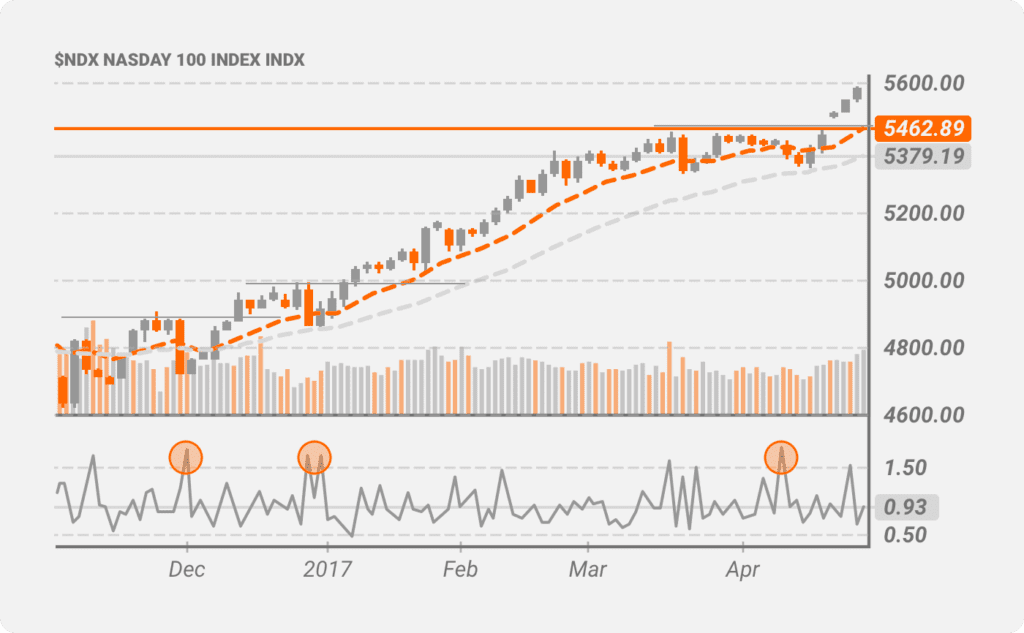
By using the TRIN and focusing on the Nasdaq’s price movements, we can make several observations. If we utilized the TRIN and were trading the NASDAQ at this time, we could make several strategic moves as well.
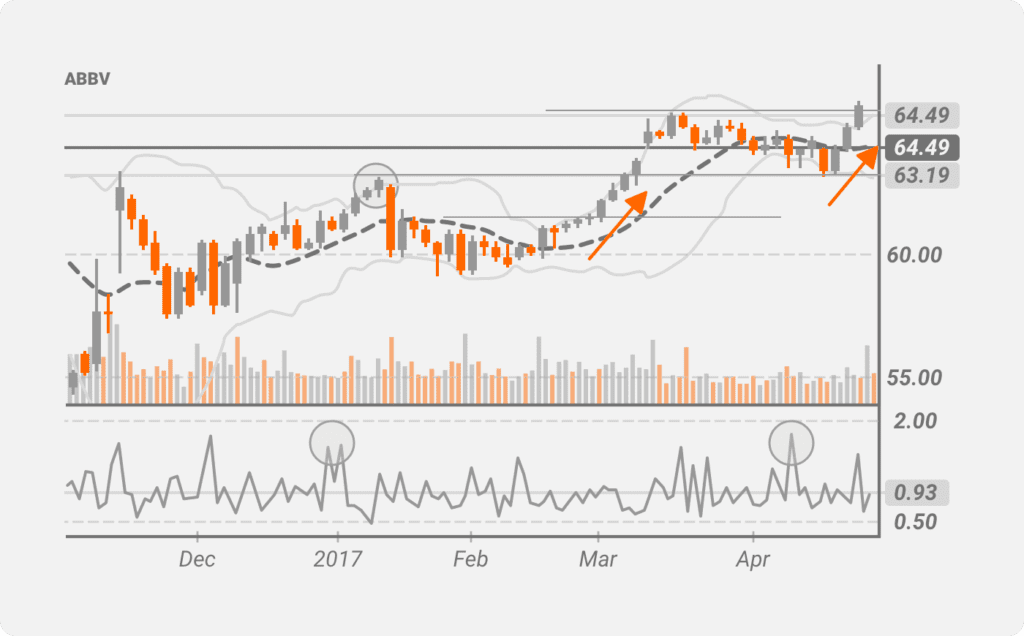
When the TRIN is above 1.0 yet below 2.0, it signals that stocks are under pressure and a short-term decline is near. In this example, there are three instances where the TRIN spiked and signaled a short-term correction in prices. The candlesticks marked by the red arrow show the resulting price action after the TRIN spiked on the chart.
In the first instance, there was a morning star type of candlestick pattern. Next, in the second instance, there was a harami-like candlestick pattern. It shows support from the 50 and 200 period moving averages. Finally, in the third instance, there was a subsequent bullish reversal candlestick pattern. This happened after the TRIN spiked and indicated a decline.
While these patterns each have differences, there is a general three-step trend here.
- Step 1: TRIN signals a correction by spiking. Price falls accordingly
- Step 2: Price confirms a reversal, and is further validated by its volume.
- Step 3: Price exceeds the previous high
Example 3
Let’s take another look at the TRIN indicator when trying to detect extreme readings with Apple’s stock.
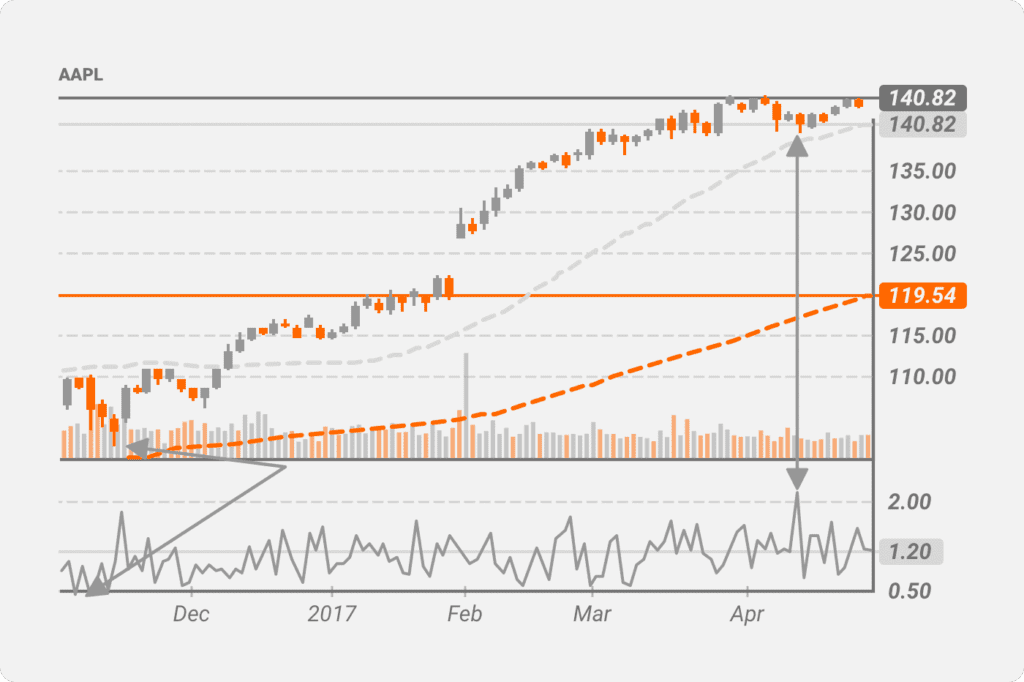
This is an example of how we can use extreme TRIN readings to predict sharp price reversals. In this example, with Apple’s stock, when the TRIN posted an extreme reading above 1.75 and below 0.5, a sharp price reversal occurred. Large-cap stocks such as Apple usually respond the most to shifts in the indicator.
Another great way to trade with the TRIN indicator is to use Bollinger Bands. By using it alongside Bollinger Bands, traders can strategically decide what moves to make depending on when the TRIN spikes and tests the upper or lower band limits. Bollinger Bands are popular technical tools consisting of a band of three lines plotted relative to security prices. The middle line is usually the 20-day moving average and serves as the upper and lower bands base. The upper and lower bands are usually set to two standard deviations away from the moving average. They are used as a way to measure volatility by observing the correlation between the bands and price. Using the TRIN indicator with Bollinger Bands could look something like this:
When used with Bollinger Bands, the TRIN indicator can be especially useful as a guide for investors when trading during spikes of volatility
Advantages of The TRIN Indicator
There are several advantages of using this indicator. Some of these advantages include the following:
- When dissecting the TRIN calculation, it gives traders a deeper insight into market performance and trends by examining which assets are advancing and which ones are declining.
- The TRIN compares net advances to volume. While most traders only pay attention to price movement, volume truly plays just as important of a role. Price movements that correlate with high volume hold more significance than price movements that correlate with low volume. Why? Low volume usually does not cause a significant price shift, while high volume implies a significant shift.
- It provides traders with a clearer picture of what is truly going in an index.
- The TRIN is a good indicator and predictor of stock movements. With the TRIN’s formula, its values serve as buy, sell, and hold signals. These values tip off traders on which way a stock or index could trend.
Disadvantages of The TRIN Indicator
While the TRIN indicator has several advantages as a helpful tool, there are also significant limitations and disadvantages.
- The TRIN is always prone to inaccurate results because of the emphasis it places on volume. For example, if there’s an instance when there are twice as many advancing stocks as declining stocks and twice as much advancing volume as declining volume, it would yield only 1.0, meaning a neutral signal. Additionally, say there were three times as many advancing stocks as declining stocks and twice as much advancing volume as declining volume. Despite the bullish day, the TRIN would yield 1.5= a sell signal! These instances are clear examples of how the TRIN can be very misleading and unreliable.
- Elaborating on the previous point, the TRIN is not always reliable as a standalone technical measurement. Traders use moving averages or Bollinger Bands in association with the TRIN, for example, to double-check the indicators’ data and reliability.
Final Thoughts
Nobody can predict the future with complete certainty. If they could, everyone would invest in the stock market. But using the Arms Index indicator can help investors make sense of price movements as they relate to volume. This helps them make more practical decisions based on the breadth and depth of these movements. Trading in the stock market will always involve risk. Day trading involves even more risk. However, understanding the TRIN indicator, reading it, and analyzing it in collaboration with other measurements, can be a useful tool for aiding traders to reach their financial goals.