The head and shoulders pattern is a classic technical indicator. It helps traders identify when (not if) an ongoing trend will reverse – if an asset is on a bull run, a head and shoulders points to an imminent bearish breakdown. Likewise, an inverse head and shoulders helps identify an asset breaking free from a bearish downward spiral.
Because the indicator is so well-known, consistent, and visually striking, it’s particularly useful for newer traders interested in stepping up their technical analysis game.
Understanding the Head and Shoulders Pattern
The head and shoulders is a favorite technical indicator signaling that an upward trend will soon reverse. If an asset is riding high on a wave of positive sentiment and upward momentum, a head and shoulders pattern points to an imminently declining price.
As the name implies, a head and shoulders indicator is defined by its three distinct parts – a left shoulder, a head, and a right shoulder.
- The Left Shoulder: the left shoulder is often the hardest to identify, as it depends on the subsequent parts. In essence, the left shoulder is only truly identifiable post-factum. The left shoulder develops as the price peaks, then dips slightly to form the neckline. In terms of price action, the left shoulder shows momentum and bullish sentiment, hitting a high point before investors begin taking profits or otherwise pulling back.
- The Head: after a brief dip, the neckline evolves into the head as the price beats the previous high embodied by the left shoulder. Near the top, the asset will sometimes begin trading sideways, fully forming the head’s crown before profit-taking begins and completes the opposing side’s neckline.
- The Right Shoulder: it mirrors the left one; whereas the asset peaked before dipping and beginning its run again, the right shoulder dips hard, rallies slightly, and then completes the pattern – ultimately leading into a complete downward trend reversal.
A Practical Example
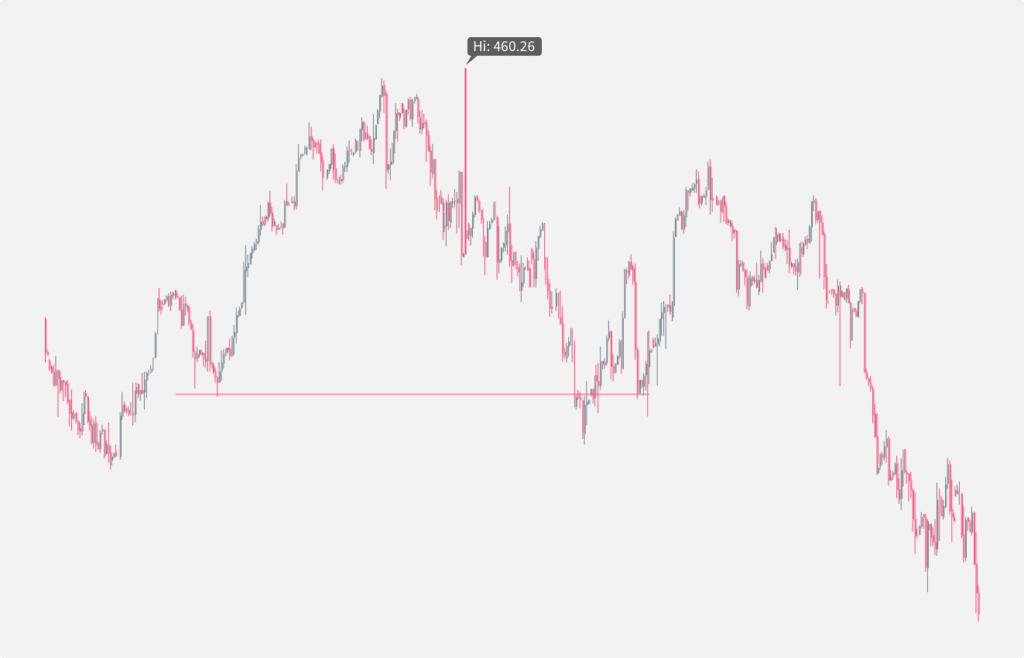
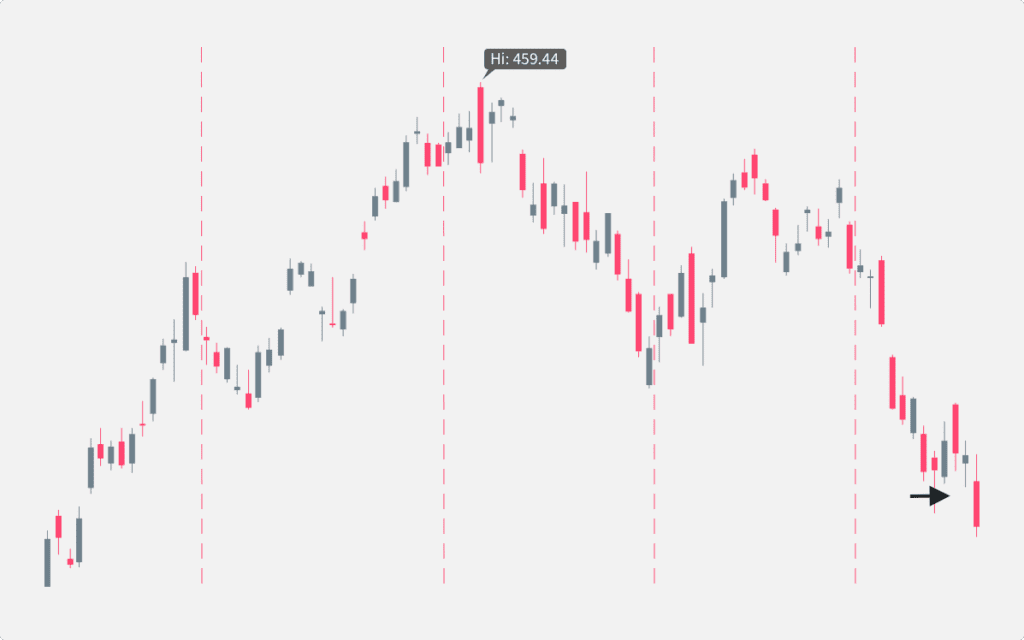
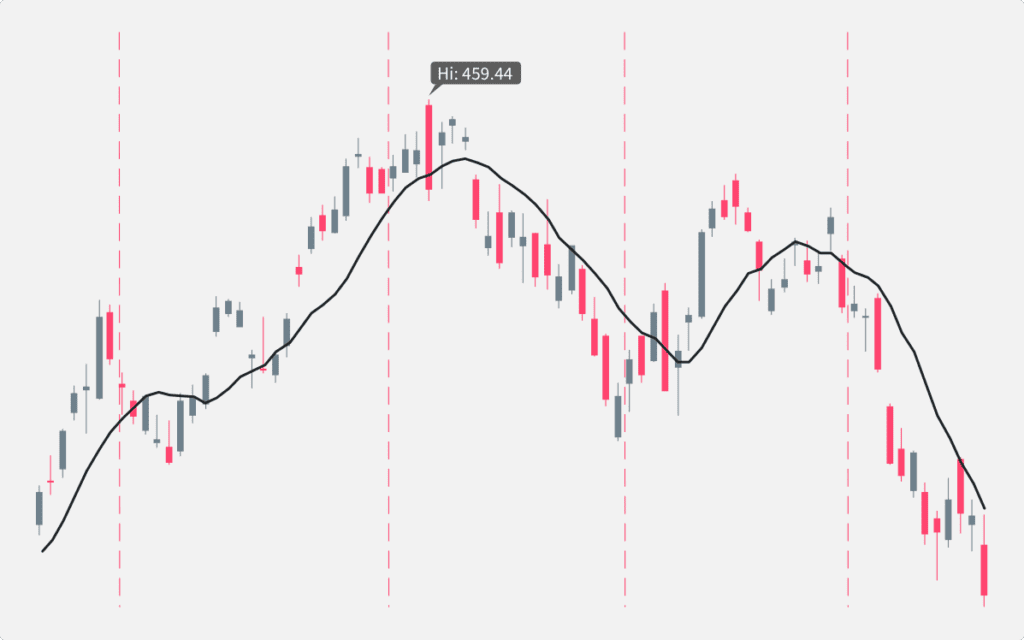
Below is a near-textbook head and shoulders pattern created by SPY over a multi-month period between May and October 2023.
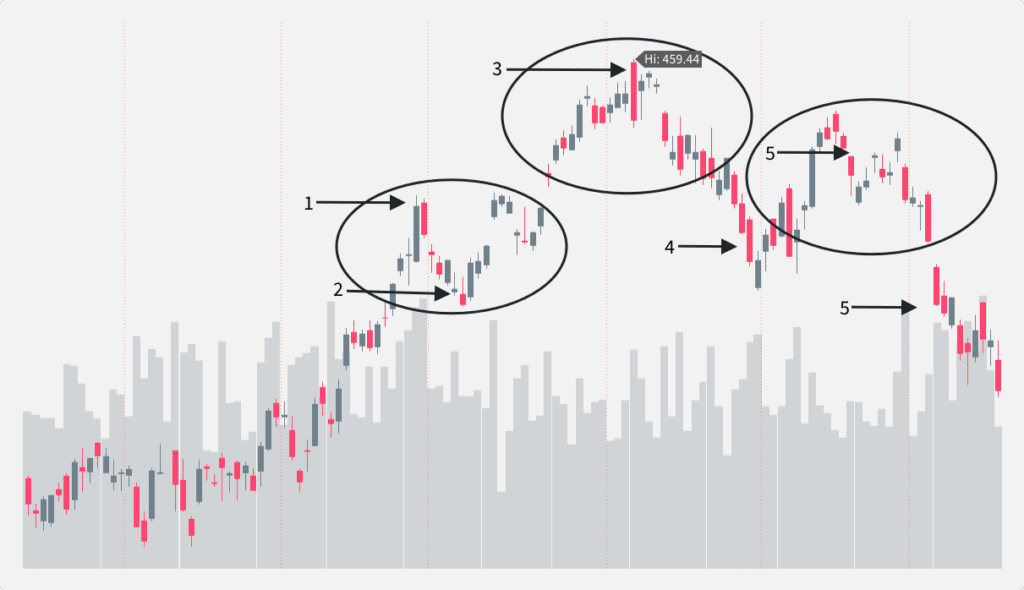
If you need help interpreting, the numbers aligned with arrows along the pattern tell the whole story:
- SPY’s uptrend peaks, and investors begin taking profit, creating the top of the left shoulder.
- Profit-taking ends, for now, and forms the pattern’s neckline.
- As the trend peaks, the head forms.
- Investors again take profit or sell shares for other reasons, creating a valley that forms the right neckline.
- Shares rally slightly, generating the right shoulder.
- The pattern is complete and indicates a trend reversal correctly as SPY moves towards its pre-May levels.
Head and Shoulders Pattern Use Cases
The head and shoulders indicator is a classic pattern with multiple use cases. Its versatility and ease of use are primary contributors to its enduring popularity.
For newer traders, the head and shoulders pattern is an excellent introduction to technical analysis. A well-executed pattern is visually striking, leaving little doubt about what’s happening compared to more complex visual descriptors. At the same time, the pattern’s straightforward interpretation – bullish turning bearish – leaves little room for interpretation. The less new analysts have to concern themselves with multiple support and resistance levels, spirals, and other obscure indicators, the better.
At the same time, professionals and advanced traders can still lean on the head and shoulders pattern to build a more comprehensive indicator arsenal. Because the head and shoulders indicator is so clear and well-defined, pinning down pivot points around the neckline and head’s crown can help experienced traders optimize exit and entry points. The head and shoulders pattern can validate or negate a trading thesis built on other indicators.
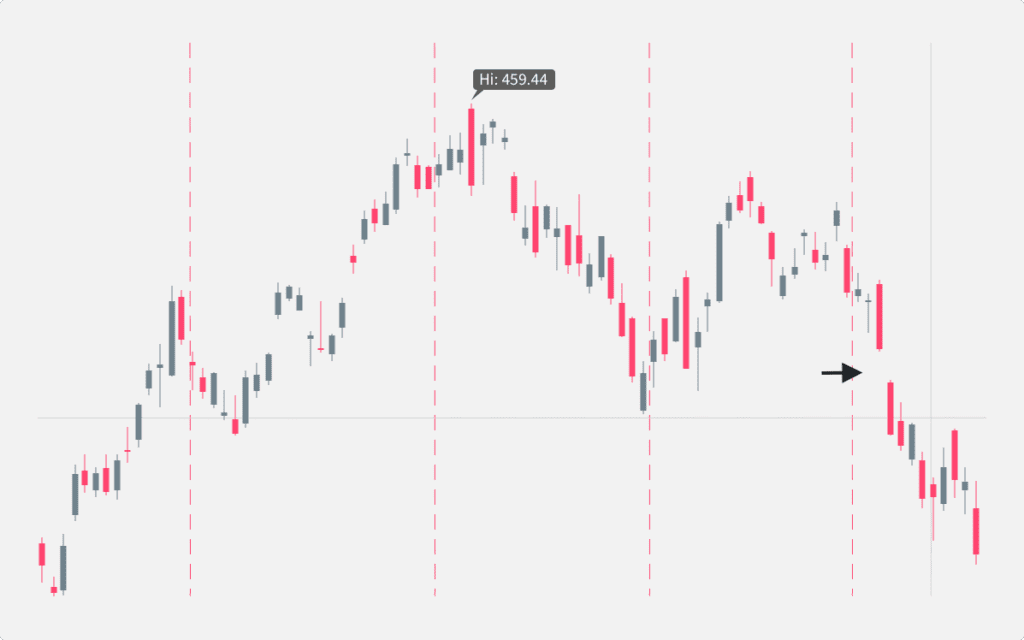
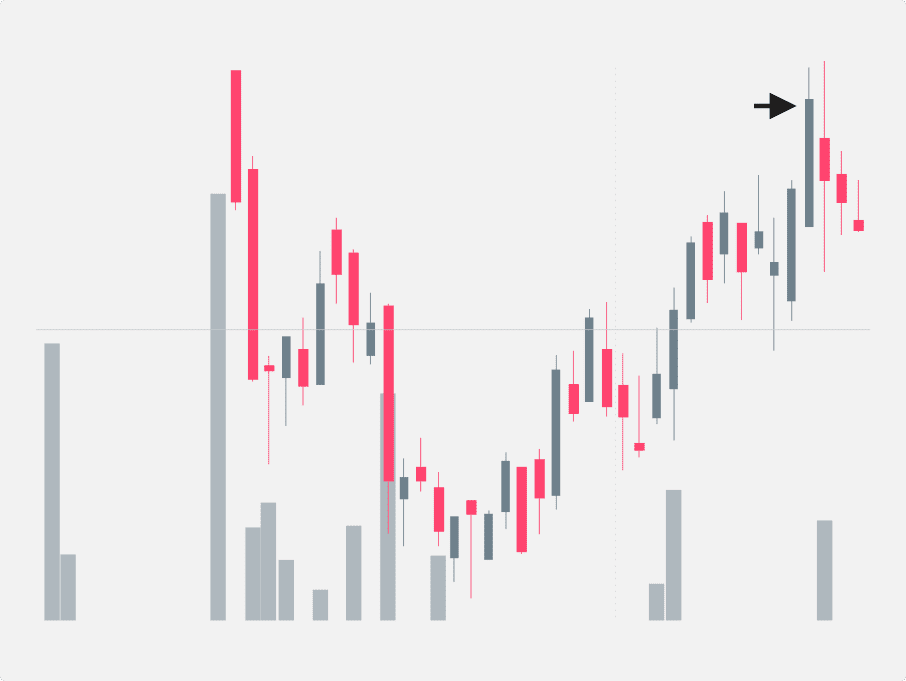
As we saw above, the head and shoulder pattern is perfect for long-term trend identification. That chart’s pattern played out over multiple months, gives patient traders plenty of time to develop a trading plan and very clear entry and exit points. But the head and shoulders pattern is equally viable on an intraday basis:
Here, we see AAPL forming a head and shoulders pattern on a daily chart before reversing its upward trend and falling nearly 2% by the trading session’s end.

Types of Head and Shoulders Patterns
The classic head and shoulders pattern serves as a bearish indicator that foretells an uptrend reversal and looks as follows:
- The left shoulder indicates the price’s peak before pulling back.
- The head forms as the asset rallies beyond the previous high, signifying the end of a bull run.
- The right shoulder develops as the price pulls back, rallies slightly, but fails to regain momentum.
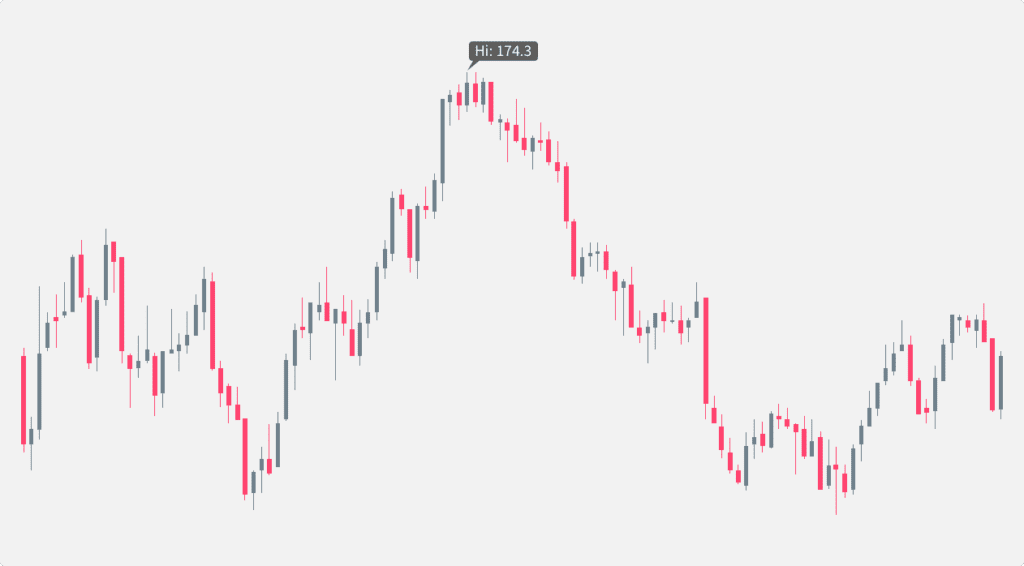
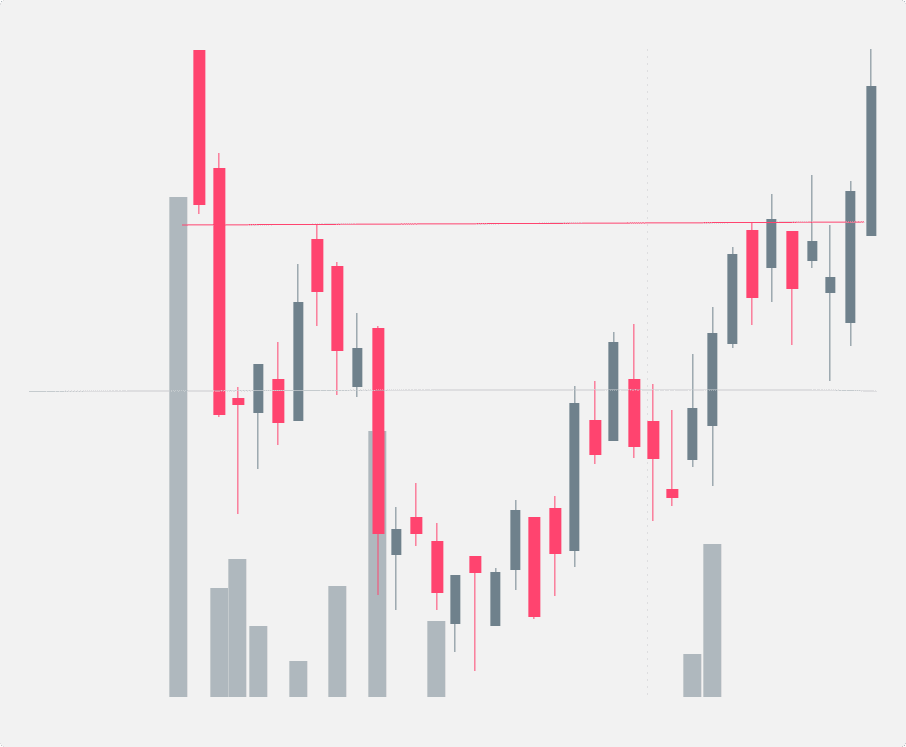
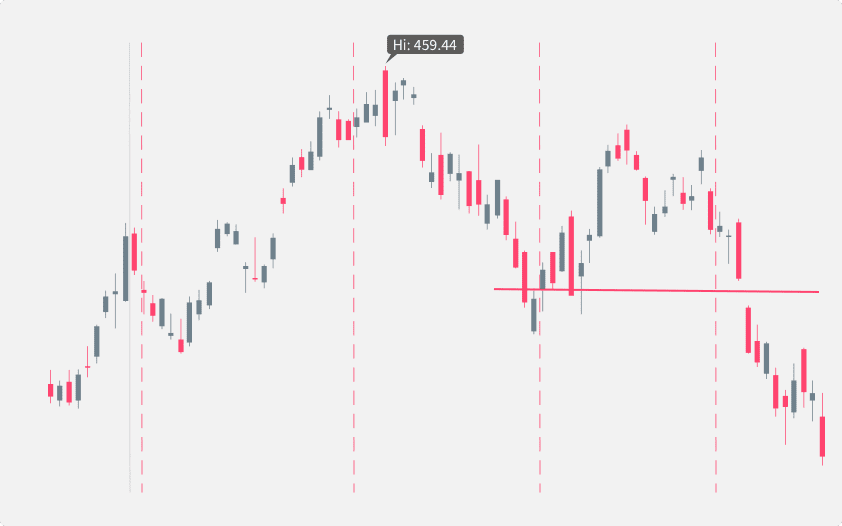
All the while, the indicator’s neckline serves as a critical support level:
The above chart shows that, as long as the pattern is forming, the neckline is the support for the trend – once the price breaks support, the indicator’s job is done as it successfully forecasts a breakdown.
Inverse Head and Shoulders
The inverse head and shoulders pattern is the same as the classic – but reversed. Not only is the visual “upside-down,” but the pattern indicates a potential breakout and reversal from a bearish trend. In an inverse head and shoulders:
- The left shoulder forms a bottom on the price’s downtrend before bouncing slightly.
- The asset falls to a new low and forms the head.
- Share prices rally to develop the right shoulder – if the indicator holds, the asset should then take off on a bullish journey.
Inverse head and shoulder patterns are sometimes a bit harder to identify, even in hindsight, due to the brain’s resistance to seeing things upside down. Still, here is NTDOY (Nintendo stock) forming a rough inverse head and shoulders before a strong rally. In this case, the neckline (as indicated) serves as resistance – once the price breaks it, the pattern’s bullish thesis is confirmed, and the stock rallies.
Using the Head and Shoulders Pattern
We’ve covered the pattern’s neckline as part of the whole, but, in many cases, the head and shoulders’ neckline is the most versatile and important part of the indicator. Momentum traders, in particular, benefit from understanding the pattern’s neckline and what it means.
We mentioned that the neckline indicates support (for a classic pattern) and resistance (for an inverse pattern). And, as with any support or resistance indicator, the neckline serves as a key mechanism for identifying breakouts and breakdowns.
Identifying Breakouts and Breakdowns
As with any trade, pinning down entry and exit points is a deliberate process – but one served well by the head and shoulders indicator.
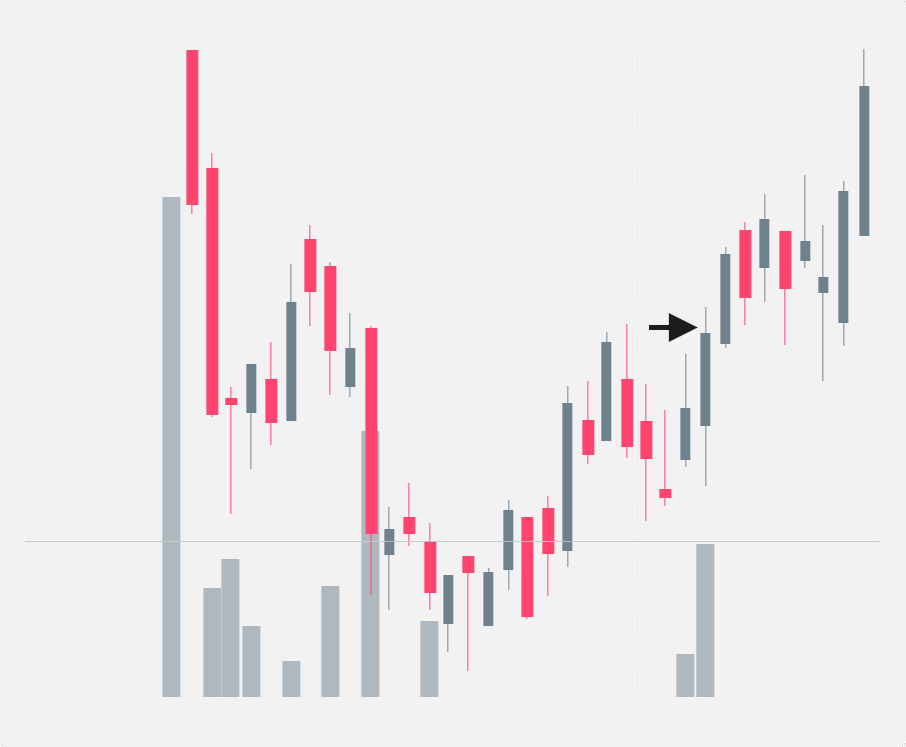
Classic Pattern Breakout: In a classic pattern, a breakdown occurs when the price closes convincingly below the neckline. Traders often wait for a clear break and enter a short position at or slightly below the neckline. This entry point is highlighted in the chart.
Inverse Pattern Breakout: For an inverse pattern, a breakout takes place when the price closes decisively above the neckline. Traders typically enter a long position at or slightly above the neckline after confirmation of the breakout.
Stop-Loss Placement
Classic Pattern: To manage risk, set a stop-loss order just above the neckline. This level acts as a crucial support-turned-resistance, and if the price reverses and rises above the neckline again, it can indicate a false breakdown.
Inverse Pattern: For an inverse pattern, place a stop-loss order just below the neckline. This level serves as a resistance-turned-support, and if the price reverses and falls below the neckline again, it may suggest a false breakout.
Exit Points
Classic Pattern: The price target for a classic pattern is often determined by measuring the vertical distance from the head to the neckline and projecting it downward from the breakdown point. Traders can consider exiting when the price approaches this target or shows signs of reversal.
Inverse Pattern: In an inverse head and shoulders, calculate the price target by measuring the head-to-neckline distance and projecting it upward from the breakout point. Traders can plan to exit as the price nears this target or if it exhibits signs of a potential reversal.
Combination with Other Indicators
Depending on your strategy, you might consider combining this indicator with:
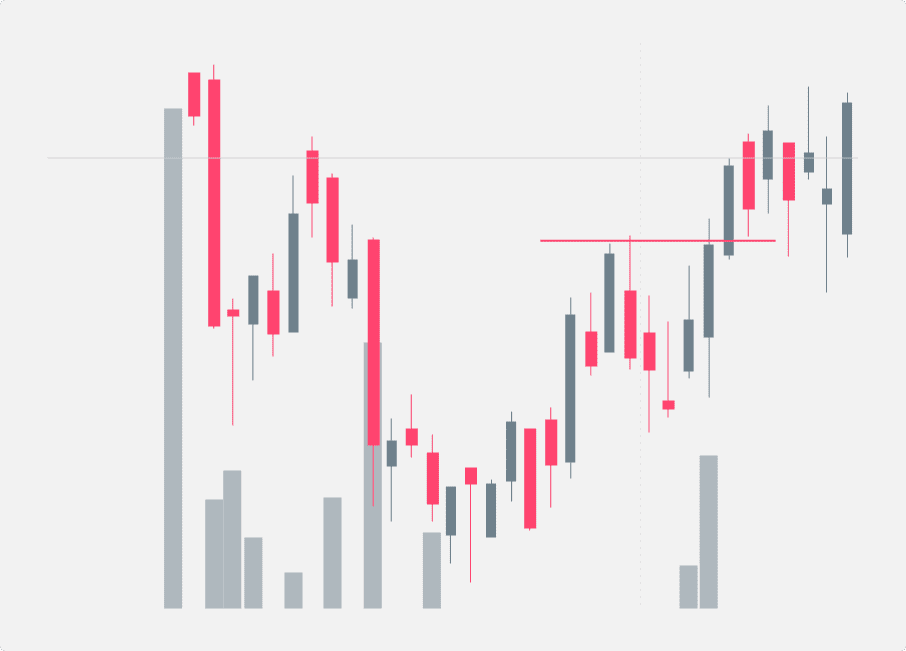
Moving Averages: Using simple moving averages can help confirm whether the pattern is moving with or against the current trend. For example, in a classic pattern, a neckline break below the SMA reinforces a bearish signal.
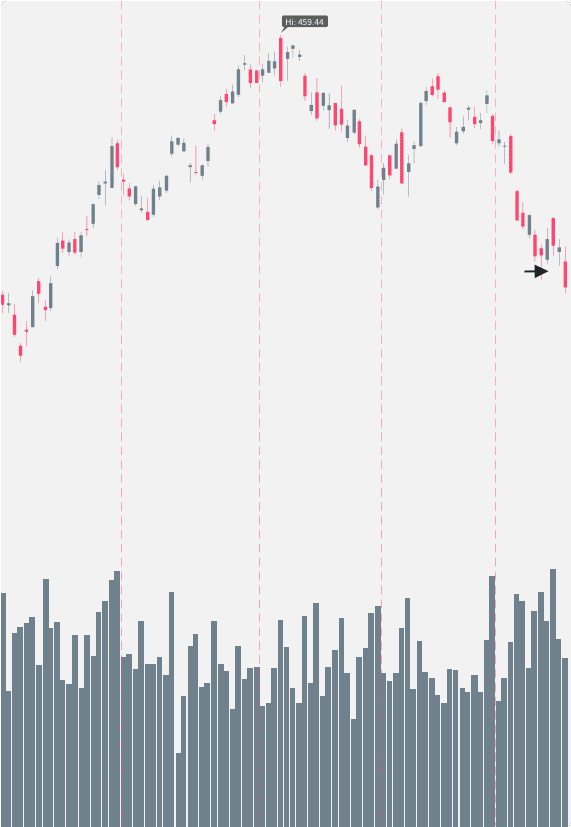
You can also use the pattern alongside volume indicators to validate the trend – remember, the greater the volume, the stronger the trend. In this case, the bearish movement is supported by a strong volume spike:
What to Look for When Using the Head and Shoulders Pattern
As with any indicator, the head and shoulders pattern shouldn’t be the sole deciding factor for entering or exiting a trade. Instead, make sure to remember that the indicator has the following benefits and drawbacks:
Pros
- Clear Visual Signal: The pattern offers a straightforward and easily recognizable visual signal for potential trend reversals, making it accessible to traders of all levels.
- Versatility: The head and shoulders pattern is applicable across different timeframes, making it suitable for all types of trading styles – from intraday trading to long-term investing.
- Confirmation of Trend Reversals: When correctly identified and confirmed, the pattern can help traders capture trend reversals early, potentially leading to profitable trades.
Cons
- Potential for False Signals: Like any technical indicator, the head and shoulders pattern is not foolproof and can produce false signals if not used in conjunction with other tools.
- Subjectivity: Identifying the pattern may sometimes involve subjective judgment, leading to variations in interpretation among traders.
- Limited to Certain Market Conditions: The pattern is most effective in trending markets and may not perform well in choppy or sideways markets.
Conclusion
The head and shoulders pattern is an excellent tool in your trading kit, beneficial for novice and experienced market navigators alike. But, as with any tool, you shouldn’t rely solely on the head and shoulders pattern to drive a trading strategy. Instead, use it as a confirmation alongside a slew of other signals like volume and moving averages. Still, for everyday traders or those dipping their toe into technical analysis, few indicators are better teachers than this one.