
Last Updated on May 6, 2024
The Advance-Decline Line (ADL) is a valuable tool for traders gauging the market’s overall direction and momentum. The ADL plots the daily difference between the number of rising and falling stocks in the market. In simpler terms, it reveals how many stocks support a market trend and its strength – in one quick glance.
What is the Advance-Decline Line Indicator?
The ADL measures stock market breadth by comparing the number of stocks that are advancing and declining. The indicator has been around for decades, and thanks to its simplicity and effectiveness, many people continue to use it today.
The ADL indicator works by calculating the cumulative sum of the daily difference between the number of advancing stocks (i.e., trading above the previous day’s closing price) and the number of declining ones.
Note: Remember, market breadth is a term that describes how many stocks are involved in a market trend. It is a way of assessing the trend’s health and quality–the greater the number supporting the move, the stronger the trend. There are other indicators that also measure market breadth, like the Arms Index (TRIN) or the McClellan Oscillator, but the ADL indicator is simpler and more straightforward to use.
The ADL indicator is a simple and effective way to measure the market’s sentiment. Plotted alongside the index’s price for each period, a rising ADL indicates that more stocks are advancing than declining and implies a bullish market. A falling ADL line signals that more stocks are declining, which indicates a bearish market.
The ADL indicator is also helpful when determining whether a price trend is likely to continue or reverse. If there is a downward trend, but the ADL line is making higher lows, it suggests fewer stocks are participating in the decline, and the downtrend may be reversing. However, if an upward trend is confirmed by an upward movement in ADL, but it makes lower highs, then fewer stocks are participating in the rally, and the uptrend may be losing momentum.

Calculating the Advance-Decline Line
The Advance-Decline Line is calculated by tracking the number of stocks that rise and fall in an index or group of stocks. The net advances are the difference between the number of advancing and declining stocks. This difference is then added or subtracted from the previous day’s Advance-Decline Line value, giving you the current ADL indicator value. If this is the first time calculating the average, the Net Advances are the first value used for the indicator. To keep the ADL updated, repeat this process each subsequent trading day.
Note: The Advance-Decline Line is a market-wide indicator applied to a basket of stocks rather than individual instruments. Therefore, net advances show how many stocks form a market trend.
Of course, nearly every trading platform or tool can generate the ADL for you – but if you are interested in testing the tool on your own, it’s easy to build.
Advance-Decline Formula
Calculating the Advance/Decline Line requires using the following formula:
ADL = Net Advances + PADL (where PADL defaults to 0 if there’s no prior ADL value)
where:
- Net Advances refers to the difference between the total number of stocks that have increased in value and those that have decreased for the day.
- PADL is the Previous ADL – the last recorded ADL indicator value.
The ADL thus reflects both the daily change in market breadth (captured by Net Advances) and the cumulative change over time (signified by the Previous ADL). That way, it indicates the market’s overall trend and its momentum.
Reading an Advance-Decline Line Chart
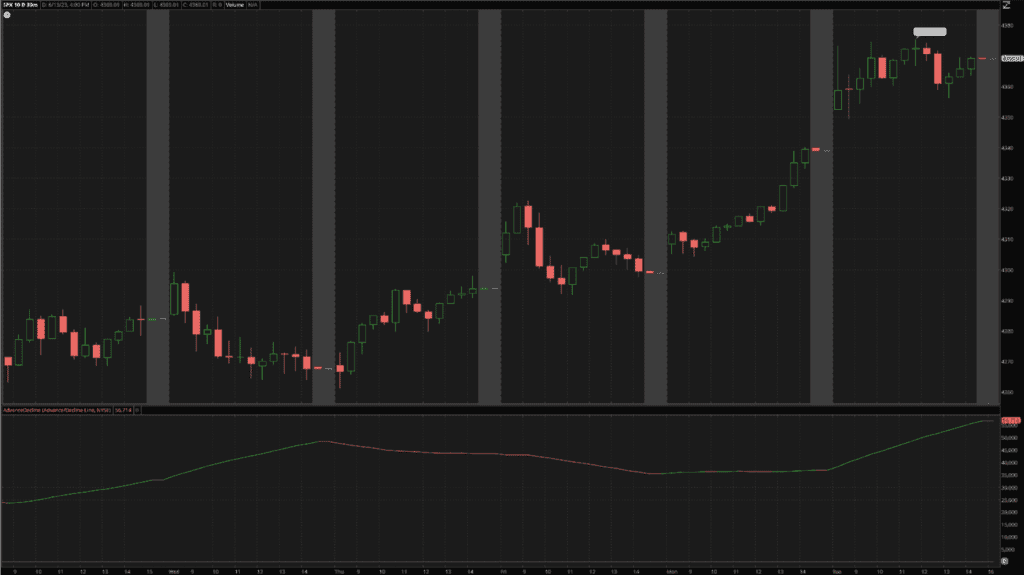
An advance-decline line chart shows the ADL indicator as a line moving up and down over time, along with the value of the index.
To read an ADL chart, you need to look at two things: the direction and slope of the ADL line and its relationship with the price of the index.
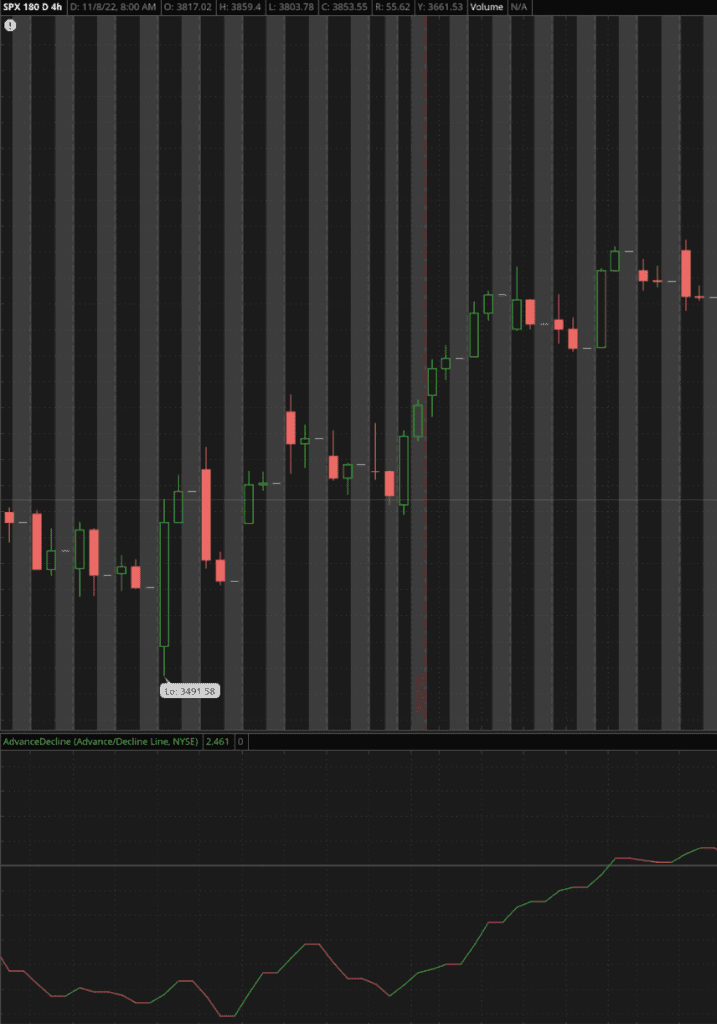
The direction and slope of the line reflect the market breadth and sentiment. When the ADL line rises, more stocks are advancing than declining, which implies positive market breadth and bullish sentiment. Alternatively, the market is in an uptrend, and traders may look for buying opportunities. The steeper the ADL line, the stronger the uptrend.
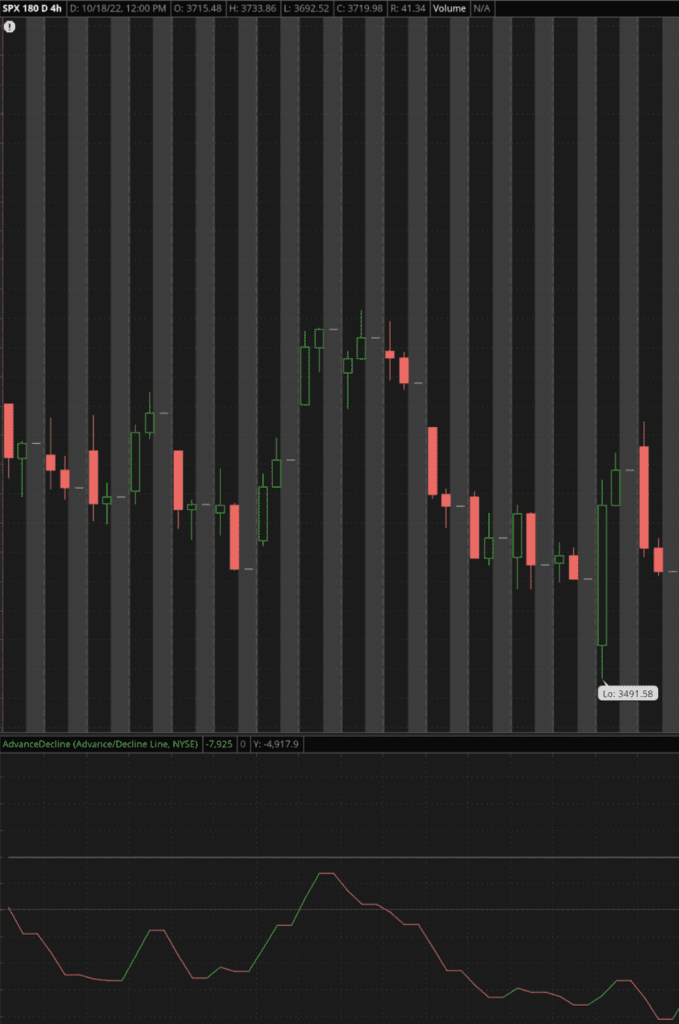
When the ADL line falls, more stocks are declining than advancing, which implies negative market breadth and bearish sentiment. This suggests that the market is in a downtrend, and traders may look for selling opportunities. The steeper the ADL line, the stronger the downtrend.
The relationship between the ADL line and the index indicates whether the trend is confirmed or contradicted by the breadth of the market. If both lines are moving in the same direction, the market trend is strong and sustainable. On the other hand, if the lines are trending in opposite directions, the trend is weak and vulnerable.
Using the ADL Indicator
The ADL Indicator is a powerful yet simple tool used to confirm price trends, spot potential reversals, and generate trading signals. Some common strategies include:
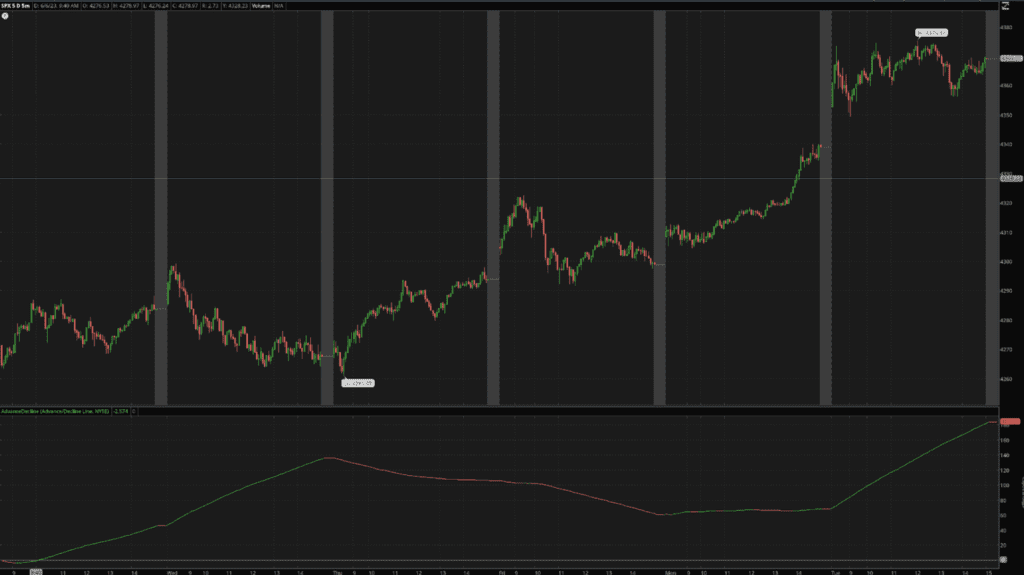
1. Confirming market trends: As mentioned above, the ADL indicator’s direction and slope can reveal the trend’s direction and strength. A rising ADL confirms an uptrend, while a falling ADL signals a downtrend. The steeper the ADL, the stronger the trend. A flat ADL line suggests a weak or sideways trend.
2. Detecting potential trend reversals: The ADL indicator can highlight possible trend reversals by diverging from the price chart of the underlying index or group of stocks. Traders can use the ADL line to look for divergence patterns that indicate a discrepancy between the price and the volume flow. Such scenarios can then be used to time their entry and exit points.
3. Generating trading signals: The ADL indicator can provide signals by crossing over a moving average or a zero line. A moving average smooths out the ADL line and creates a signal line. A crossover between the ADL line and the signal line indicates a change in market direction. Traders can use different moving average periods to suit their style and time horizon.
4. Analyzing market breadth: The relationship between the ADL line and the price’s movements can provide valuable insights into the market’s health. If the indicator rises higher than the current price of a stock, it may suggest that the market is driven by a few strong stocks and overall breadth is weakening, whereas if it falls below the current price of a stock, it may indicate that weak stocks are driving the market and the overall breadth is improving.
Advantages and Disadvantages of the ADL Indicator
The ADL indicator can be used in a variety of ways, but it also comes with a series of advantages and disadvantages that should be taken into consideration:
Advantages of the ADL Indicator
- Easy calculation: The ADL indicator is easy to calculate and simple enough for even beginners to use.
- Measuring market breadth: It is an excellent tool for identifying the breadth of the market. The indicator helps traders determine whether a market move is driven by a handful of stocks or if it has broad market support.
- Providing early-warning signals: Divergences between ADL, price, and other indicators are usually early-warning signals of potential trend reversals. This can give traders a head start in adjusting their positions or taking advantage of upcoming opportunities.
- Works well as a confirmation tool: The ADL can serve as an edge-finder alongside other technical indicators, such as moving averages or oscillators.
Disadvantages of the ADL Indicator
- Variability in the calculation: The ADL can vary in its usefulness since it can be calculated with just a handful or hundreds of stocks. As a result, its signals won’t always have the same weight.
- False signals: The ADL indicator is subject to noise and whipsaws in volatile markets. For instance, a crossover between a moving average or zero line on one chart and the ADL line on another may not indicate a genuine change in market direction – only temporary fluctuations.
- Limited capability: ADL indicator is limited in its ability to track short-term trends and predict significant movements. Also, it doesn’t provide information on price levels or targets. Furthermore, traders can’t use the ADL indicator to determine where to place stop-loss or take-profit orders or measure risk-reward ratios.
- Subjective interpretation: The ADL indicator is subjective, and opinions and experience play a role in interpreting its values. Although its values can be objectively analyzed, traders may have different opinions on what constitutes a significant divergence or what levels indicate overbought or oversold conditions.
Advance-Decline Line (ADL) vs Arms Index (TRIN)
The Advance-Decline Line (ADL) and the Arms Index (TRIN) are technical indicators measuring market breadth.
ADL is a visual complement to the price charts of an index or group of stocks. It plots the difference between the number of advancing and declining stocks daily and, through its direction and slope, shows the market trend’s direction and strength. The ADL line can also diverge from the price chart of an index or group of stocks to signal a possible trend reversal.
The TRIN is a relative indicator that calculates the ratio of advancing and declining stocks to the ratio of advancing and declining volume. It shows the sentiment and momentum of the market by moving above and below a centerline of 1. A value above 1 implies negative market breadth and bearish sentiment, while a value below 1 implies positive market breadth and bullish sentiment.
The ADL and TRIN are indicators that use the same underlying data but provide different types of information. The ADL is a long-term indicator that reflects the overall health and direction of the market’s breadth over time. The TRIN, on the other hand, compares the number and volume of advancing and declining stocks. As such, they are best used together to provide a more complete picture of market breadth.
Conclusion
The Advance-Decline Line (ADL) may not be the most effective tool for day traders, but it still has its place in technical analysis. When used alongside the Arms Index (TRIN) and with the primary trend, the ADL can confirm market trends and provide valuable insights into market sentiment.
The ADL is a helpful tool for confirming the direction and strength of a trend. It can also give traders an early warning of potential trend reversals by diverging from the price chart of an index or group of stocks. These factors make it an essential tool for complementing other indicators and enhancing strategies’ efficiency.
By analyzing the ADL line in conjunction with other technical indicators, traders can gain a deeper understanding of market conditions and make more informed trading decisions.