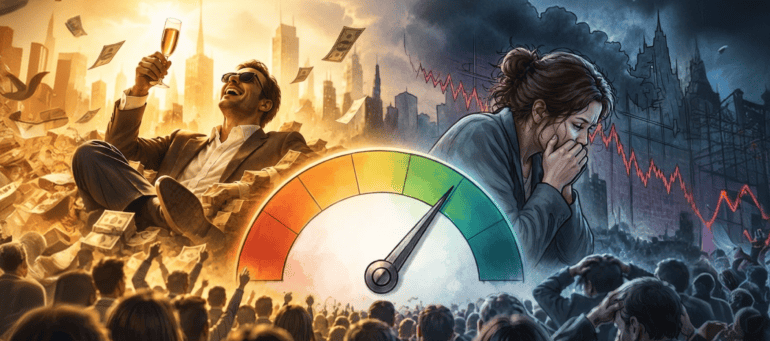
Economic data, corporate earnings, interest rates, inflation, employment reports, geopolitical developments – factors like these are critical to where the market is and will go next. Yet, facts aren’t everything and human emotions play a big part. In other words, prices are often driven by collective opinion before they are driven by intrinsic value. And nothing shapes collective opinion more significantly than fear and greed. While the former exaggerates bad news, the latter magnifies optimism.
The bottom line is that entire market trends can emerge not because fundamentals have changed dramatically overnight, but because investors collectively decide to view those fundamentals through a different emotional lens. Few indicators attempt to measure that emotional pulse as directly as the Fear & Greed Index.
In this guide, we will explore what the Fear & Greed Index is, how it works, and what makes it so useful in navigating the market environment. Most importantly, we will examine how every funded trader or participant in funded trading programs such as Earn2Trade’s Trader Career Path® and The Gauntlet Mini™ can capitalize on the insights the Fear & Greed Index generates to improve performance and consistency. Let’s dive in!
What Is the Fear & Greed Index?
While the Fear & Greed Index is often described as a sentiment indicator, in reality, it is more than that. Think of it as a benchmark and a composite measure of investor behavior.
Traditional economic indicators such as inflation or unemployment can be observed directly. Yet, sentiment can’t, since investors don’t collectively announce whether they feel optimistic or pessimistic before each trading session – they show it through their behavior.
Do investors prefer stocks or government bonds? Are market advances broad-based, with hundreds of companies participating, or are only a handful of mega-cap stocks carrying the indexes higher? Is volatility increasing despite rising prices? These behaviors collectively paint a picture of market psychology.
Originally popularized by CNN Business, it was designed to answer a simple question: Is the market currently driven more by fear or greed? Rather than relying on opinions or surveys alone, it combines several market-based indicators (we will discuss which ones exactly in the next section) to estimate investor sentiment on a scale from 0 to 100.

How the Fear & Greed Index Works
The original Fear & Greed Index combines seven separate market indicators which, together, quantify whether investors are embracing risk or avoiding it. Readings below 25 typically indicate extreme fear, while readings above 75 suggest extreme greed.
| Component | What It Measures | Emotional Signal |
| Stock Price Momentum | Strength relative to longer-term averages | Confidence or caution |
| Market Breadth | Number of advancing versus declining stocks | Participation |
| Stock Price Strength | New highs versus new lows | Bullish conviction |
| Put/Call Ratio | Demand for protection | Fear versus optimism |
| Market Volatility (VIX) | Expected future volatility | Anxiety |
| Safe-Haven Demand | Stocks relative to Treasuries | Risk appetite |
| Junk Bond Demand | Investor willingness to own riskier debt | Confidence in economic conditions |
Now let’s explore two interesting examples of how fear and greed typically work in practice. During the technology bubble of the late 1990s, investor optimism reached extraordinary levels, with companies with little revenue achieving multi-billion-dollar valuations because participants assumed future growth would justify almost any price. While greed didn’t create the bubble by itself, it amplified every optimistic assumption.
The opposite occurred during the Global Financial Crisis – fear became so overwhelming that fundamentally sound companies traded at valuations implying catastrophic long-term outcomes. Investors sold not because every company had suddenly become worthless, but because uncertainty overwhelmed rational valuation.
Both episodes demonstrate that markets often become most dangerous when emotional consensus becomes strongest.
What Drives the Fear & Greed Index Higher and Lower?
Although the Fear & Greed Index appears as a single number, it is ultimately the product of thousands of individual decisions made by institutions, hedge funds, pension managers, algorithmic trading systems, and retail investors. Those decisions don’t occur in isolation – instead, they are shaped by economic data, monetary policy, corporate earnings, geopolitical developments, liquidity conditions, and countless other variables that influence investor confidence.
For example, during periods of improving economic conditions, sentiment tends to strengthen gradually, with inflation moderating without collapsing economic growth, unemployment remaining low, companies reporting resilient earnings, and interest rates stabilizing or even declining.
Together, these developments encourage investors to increase their exposure to risk assets, pushing equity indexes higher while reducing demand for traditional safe havens such as U.S. Treasuries. Volatility can decline because investors become less concerned about unexpected shocks, while credit spreads might narrow as confidence in corporate borrowers improves.
While none of these developments individually creates “greed,” collectively they can cause optimism to self-reinforce. That can lead to rising prices attracting new buyers, who in turn push prices even higher, with improving portfolio performance encouraging additional risk-taking.
George Soros described this process through his theory of reflexivity, arguing that market perceptions can influence fundamentals just as fundamentals influence market perceptions. Bull markets often strengthen as participants believe they will continue, creating a feedback loop between expectations and price action.
Fear develops through a similar mechanism – e.g., a disappointing inflation report, a surprise interest-rate hike, geopolitical conflict, banking instability, or weakening corporate earnings can all begin shifting investor psychology toward caution. While initially the response may be measured, as prices continue declining, uncertainty might grow, and investors who were previously comfortable holding risk assets might begin reducing exposure, pushing volatility higher and creating additional selling pressure. News headlines might then become increasingly negative, leading analysts to revise forecasts downward, and the market narrative to gradually shift from optimism to preservation.
This dynamic explains why bear markets often feel much faster than bull markets. Nobel Prize-winning psychologist Daniel Kahneman demonstrated that people experience the pain of losses far more intensely than the pleasure of equivalent gains, meaning fear often spreads more rapidly than confidence.
Why Futures Traders Should Care About Sentiment
Many futures traders initially dismiss sentiment indicators because futures markets are often viewed through a more technical or macroeconomic lens. After all, futures contracts are driven by supply and demand, interest rates, central-bank policy, inventory reports, earnings expectations, and institutional positioning.
So, it is natural to wonder why an emotional indicator matters.
The truth is, it does, since one or more of those variables can often influence human decisions, resulting in buying and selling pressure that becomes visible on price charts long before emotions appear in economic reports.
For funded traders, understanding this relationship provides an additional layer of context. For example, suppose the S&P 500 has rallied steadily for several weeks. Technical indicators remain bullish, earnings continue exceeding expectations, and economic data appears supportive. At the same time, the Fear & Greed Index climbs above 85. Does that automatically mean traders should short the market? Absolutely not.
One of the biggest misconceptions surrounding sentiment indicators is believing that extreme readings immediately predict reversals, but the truth is that markets can remain extremely optimistic for weeks, or even months, during strong bull markets. Likewise, they can remain deeply fearful throughout prolonged bear markets.
So, the essence is that the Fear & Greed Index is therefore not a timing tool, but a context tool that helps answer questions such as:
- Is optimism becoming excessive?
- Are investors ignoring potential risks?
- Is fear creating opportunities that may not exist during more balanced conditions?
- Are market participants behaving rationally or emotionally?
These questions matter because crowd psychology often influences volatility. For example, when investors become excessively optimistic, disappointments produce larger reactions because expectations leave little room for error. Conversely, when fear dominates, even modestly positive news can trigger surprisingly powerful rallies.
In that sense, the Fear & Greed Index attempts to identify precisely where markets may reside along that emotional spectrum. While it can’t identify the exact turning point, it can remind traders when positioning may have become increasingly one-sided, encouraging tighter risk management without forcing premature countertrend trades.
Using the Fear & Greed Index Across Different Futures Markets
Although the Fear & Greed Index was originally designed with the U.S. equity market in mind, its influence extends well beyond stock index futures. Since investor sentiment affects capital allocation across multiple asset classes, funded futures traders can use changes in market psychology to better understand the relationships between equities, bonds, commodities, and currencies. Doing so requires recognizing that each market responds differently to shifts in risk appetite rather than assuming that fear or greed affects every contract in exactly the same way.
Equity index futures naturally exhibit the strongest relationship with the index because they directly reflect investor willingness to own risk assets. During periods of increasing optimism, contracts such as the E-mini S&P 500 (ES), Nasdaq-100 (NQ), and Russell 2000 (RTY) often benefit from expanding participation, improving market breadth, and declining volatility.
As greed becomes excessive, however, traders should begin paying closer attention to deteriorating internals. Markets can continue making higher highs while fewer stocks participate, creating negative divergences that frequently precede larger corrections.
Treasury futures often move in the opposite direction as investors rotate away from safe-haven assets and toward equities.
Gold presents a more nuanced picture. Although commonly viewed as a safe-haven asset, gold also responds to real interest rates, inflation expectations, and central-bank demand, meaning fear alone doesn’t always determine its direction.
Crude oil, meanwhile, is influenced by sentiment as well as supply-demand fundamentals, making it particularly sensitive when geopolitical developments coincide with changing investor confidence.
Even currency futures reflect shifts in global risk appetite, with traditional safe-haven currencies often outperforming during periods of heightened uncertainty.
For funded traders managing diversified watchlists, the Fear & Greed Index therefore becomes less about identifying trades in a single market and more about understanding the emotional environment connecting multiple markets simultaneously.
Sentiment as a Compass, Not a Crystal Ball
One of the biggest misconceptions surrounding the Fear & Greed Index is that it functions as a trading signal. New traders often assume that an “Extreme Fear” reading means markets are about to rally or that “Extreme Greed” guarantees an imminent correction.
In reality, sentiment indicators are best viewed as context rather than prediction. They tell traders how market participants are collectively positioned emotionally, but they say very little about when those emotions will reverse. And it isn’t any different with the Fear & Greed Index. The tool provides context rather than certainty, and it should never replace price action, risk management, or disciplined execution. Instead, it complements them by reminding traders that every candle on a chart represents thousands of individual decisions made under uncertainty.
History repeatedly demonstrates that markets can remain irrational far longer than most traders expect. Throughout the post-pandemic recovery, for example, optimism surrounding artificial intelligence and large-cap technology companies kept sentiment elevated despite frequent warnings that valuations had become stretched. Traders who sold simply because the Fear & Greed Index entered “Extreme Greed” often found themselves fighting one of the strongest bull markets in decades. The same principle applies in reverse.
During the depths of the COVID-19 market collapse in March 2020, sentiment reached extraordinarily fearful levels. Many traders interpreted those readings as buying signals, only to discover that panic can deepen considerably before markets stabilize.
However, as legendary economist John Maynard Keynes famously noted, markets can remain irrational longer than traders can remain solvent. The value of the Fear & Greed Index, therefore, lies in helping traders recognize when expectations have become increasingly one-sided. Once a market reaches that stage, risk management deserves more attention because surprises tend to have a disproportionate impact when everyone is already leaning in the same direction.
A Practical Framework for Using the Fear & Greed Index Without Falling Into Its Traps
Like virtually every market indicator, the Fear & Greed Index is most valuable when incorporated into a broader decision-making framework instead of a standalone trading system. Since no single indicator can consistently predict market direction (sentiment is certainly no exception), the index should function as a filter and a way of assessing the psychological backdrop against which technical patterns, macroeconomic developments, and risk management decisions unfold.
So, here is one way to apply it in practice. First of all, start your routine before the opening bell. Rather than immediately scanning charts for trade setups, spend a few minutes assessing the broader environment. Has the index been climbing steadily for several weeks, suggesting that optimism has become entrenched? Has it collapsed into Extreme Fear after a series of disappointing economic releases?
Also, ask whether the current reading aligns with what price action is actually doing. If the Fear & Greed Index remains elevated while market breadth deteriorates and volatility begins to creep higher, the emotional backdrop may be changing before prices fully reflect it. Conversely, if sentiment remains deeply pessimistic despite markets stabilizing and buyers gradually returning, the probability of a sustained recovery may be improving.
Then, once the trading session begins, sentiment should influence expectations rather than dictate execution. Imagine your trading plan identifies a long setup in Nasdaq futures immediately after a stronger-than-expected earnings report from several major technology companies. If the Fear & Greed Index sits near neutral, there is little reason to adjust your approach beyond normal risk management. However, if the index has spent the previous two weeks above 90, suggesting widespread optimism, you may choose to scale out of winning positions more aggressively or reduce overall position size.
The opposite logic applies during periods of widespread fear. Extreme pessimism doesn’t guarantee a rally, but it often creates conditions where markets become highly sensitive to unexpectedly positive developments. Earnings that are merely “less bad” than anticipated, inflation reports that come in slightly below expectations, or central-bank statements that sound marginally more dovish can spark surprisingly powerful recoveries because so much bad news has already been priced in.
Ultimately, the Fear & Greed Index should answer one question before every trade: What emotional environment am I stepping into? Once that question has been answered, technical analysis and disciplined execution should take over.
Below is one example of a practical framework that can help funded futures traders incorporate sentiment into their daily routine without allowing it to dominate the decision-making process.
| Step | Practical Question | Why It Matters |
| Check the Index Before the Open | Is sentiment neutral, fearful, or greedy? | Establishes the emotional backdrop before looking at charts. |
| Compare Sentiment With Price Action | Does the chart support the prevailing sentiment? | Identifies potential divergences between psychology and price. |
| Review Market Breadth and Volatility | Are more stocks participating, and is volatility expanding or contracting? | Confirms whether sentiment is strengthening or weakening. |
| Adjust Expectations, Not Rules | Should position size or profit targets change? | Maintains discipline while acknowledging changing probabilities. |
| Monitor Key Catalysts | Are CPI, FOMC, Non-Farm Payrolls, or earnings likely to shift sentiment? | Recognizes that major news can quickly change market psychology. |
| Review Your Own Emotional State | Am I becoming influenced by the crowd? | Prevents personal emotions from mirroring market sentiment. |
| Stick to the Trading Plan | Does the setup satisfy my predefined rules? | Ensures execution remains process-driven rather than emotionally driven. |
Common Mistakes Traders Make When Using the Fear & Greed Index
Many traders begin using the indicator with unrealistic expectations, believing it offers a shortcut to identifying market tops and bottoms. When those expectations inevitably prove false, they dismiss the index entirely rather than recognizing that the problem lies in how it was applied.
Wrongful Application
Perhaps the most common mistake is treating extreme readings as automatic reversal signals. History repeatedly demonstrates that markets can remain in Extreme Greed or Extreme Fear territory for extended periods. For example, during the final stages of powerful bull markets, optimism often intensifies before prices eventually reverse.
Likewise, during major bear markets, fear can deepen long after many traders believe markets have become “too cheap.” Selling every time greed becomes elevated or buying every time fear spikes often results in repeatedly fighting established trends.
Not Taking Market Specifics Into Account
Another frequent mistake involves ignoring market-specific dynamics. The Fear & Greed Index primarily reflects conditions in U.S. equities, yet many traders apply it indiscriminately across unrelated futures markets. While broad sentiment certainly influences contracts such as the E-mini S&P 500 or Nasdaq futures, markets like crude oil, natural gas, soybeans, or live cattle frequently respond more strongly to supply disruptions, weather patterns, inventory reports, or geopolitical developments than to shifts in investor sentiment.
So, context matters and, while the Fear & Greed Index can complement those markets, it should rarely dominate the analysis.
Bias Reinforcement
Funded traders also need to guard against allowing the index to reinforce existing biases. Suppose a trader already believes the stock market is significantly overvalued. Seeing the Fear & Greed Index reach Extreme Greed may appear to validate that opinion, encouraging premature short positions despite continued bullish price action.
This is where anchoring bias and confirmation bias often intersect. Instead of objectively evaluating new information, traders selectively embrace indicators supporting their existing beliefs. Professional traders avoid this trap by asking a different question: Does the current price action actually confirm what sentiment appears to suggest? If the answer is no, the chart deserves greater weight than the indicator.
Wrong Timing
Finally, many traders overlook the importance of timing. Sentiment changes gradually, whereas futures markets often move rapidly. The Fear & Greed Index is therefore much more useful for establishing the broader backdrop over days or weeks than for making minute-by-minute trading decisions.
To Wrap Up: Trade the Crowd’s Emotions, Not Your Own
Financial markets have always been driven by two competing forces. One encourages investors to chase opportunity because they fear missing out on future gains, while the other urges them to protect capital because they fear losing what they already have. Every rally, every correction, every panic, and every speculative bubble can ultimately be traced back to the changing balance between those two emotions.
The Fear & Greed Index attempts to measure that balance. Like any other tool, it isn’t perfect, nor was it intended to be. You can’t use it to predict the exact day a bull market will peak or identify the precise bottom of every correction. However, it can be very useful in providing you an alternative perspective – one focused on the emotions and the fingerprints they leave on price action long before they appear in economic textbooks.
For funded traders and participants in funded trading programs like Earn2Trade’s Trader Career Path® and The Gauntlet Mini™, adding sentiment analysis to the set of risk management, technical, and macroeconomic instruments can prove invaluable in enhancing performance and consistency. And most importantly, to help remain objective when others become emotional.